A Great Day of Trading on July 31, 2013: 5/5 ITM!
Just like on Monday, my Fibonacci retracement lines and pivot points definitely helped a ton in trading the USD/CHF. I started watching the market around midnight EST as price was coming down from the daily pivot point.
The first two hours were pretty uneventful. The market doesn’t move much between 12AM-2AM EST since neither the European banks and certainly not the U.S. banks are active at all in trading at this point. So if I’m not near any support or resistance points, it’s just mostly a matter of sitting still or even doing something else altogether since the market simply will not move much.
But overall the 0.92972-0.92979 range was a very solid resistance zone due to the overlapping effect of the 78.6% Fibonacci retracement (relevant to the price move 0.91748-0.97500) and the daily pivot point being in close proximity to each other. Nothing set up neatly on the pivot point, but on the 1:55 candle, I did get a touch and rejection of the 78.6% Fib and a re-touch on the 2:00 candlestick. Therefore, I took a put option at that touch of 0.92979. It ended up as about a two-pip winner.
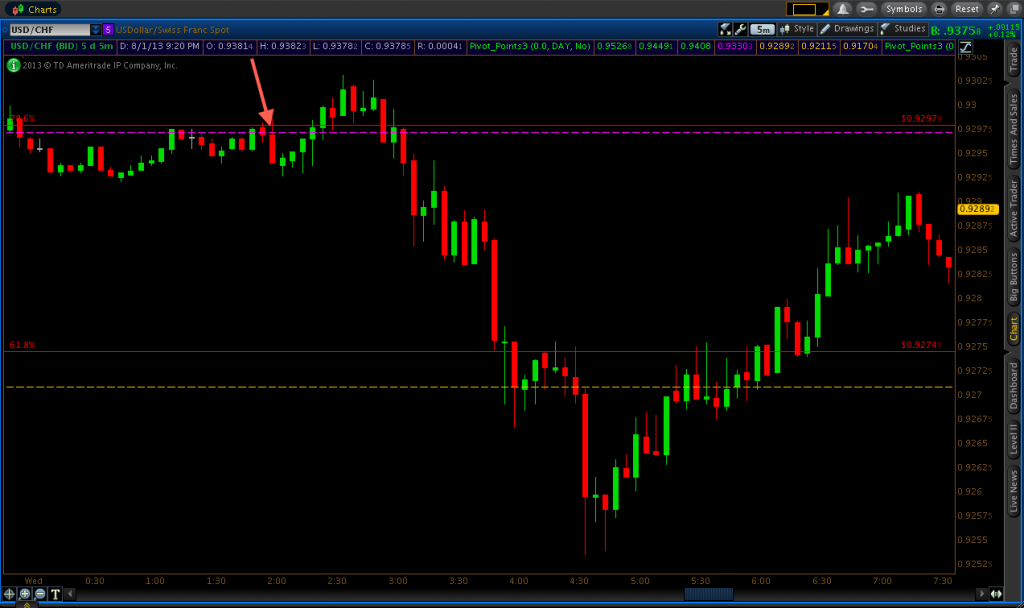
Price did come up and touch the 78.6% Fib again on the 2:20 candlestick, but I decided not to take any further trades there. Based on the previous day, price had been hanging around the 78.6% retracement frequently and even busting through it on occasion. I judged the probability to be in my favor on the first test of the morning and the set-up was good. But the second try was a lower probability set-up due to the entire concept of diminished sensitivity once a level is tested over and over again (i.e., it’s not as likely to hold). After I bypassed that trade, sure enough price breached both the pivot and 78.6% Fib.
Nevertheless, about an hour later, it fell back through and set up what would become a downtrending market. It fell down to the 61.8% Fibonacci retracement, which was relevant to a larger-scale price move that I have drawn all the way out on the weekly time compression (0.70675-1.06387). However, the 61.8% Fib had been touched in each of the three prior trading days, as well, so one can expect some reduced sensitivity regarding this level as well. Given that the yellow support 1 line was sitting at 0.92708 – less than four pips below the 61.8% Fib – I decided to wait for the touch of that unless a solid set-up occurred at the 61.8, which would be dictated by the price action.
When price reached the 61.8, it reached down to the support 1 level on the same candle. It wicked back above both levels. When it re-touched support 1 (0.92708) on the next candle, I took a call option right at the level. This trade was up-and-down throughout, but support 1 held pretty well and I had a three-pip winner.
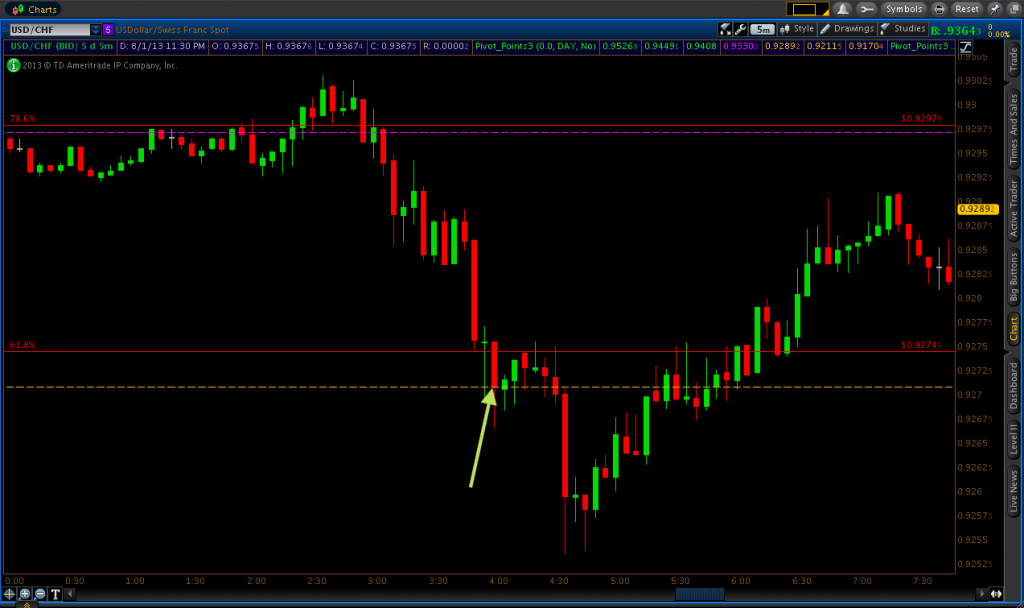
Less than fifteen minutes after the conclusion of that trade, I decided to take a put option set up at the 61.8% Fibonacci retracement (0.92745). A hammer candle had formed on the 4:20 candlestick (common indication of price reversal), followed by a bearish 4:25 candle. The trend was also definitely down. So upon the touch of 0.92475 I took a put option and had an exceptional result. Not too long after my entry, it was 20 pips in favor before settling as a 15-pip winner.

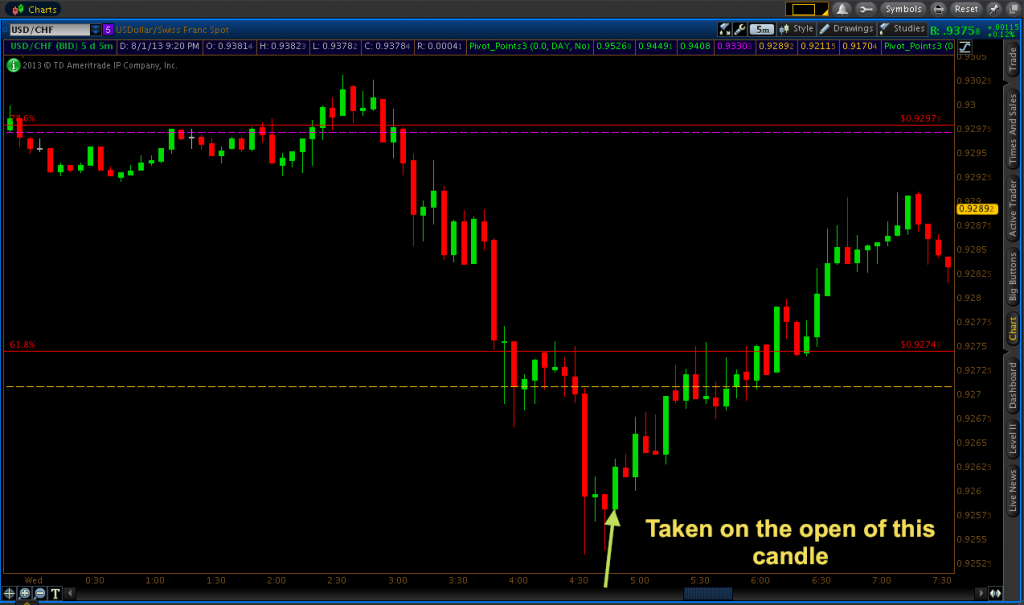
After that, price formed a bottom at around 0.92581. There had been a series of three consecutive bottom wicks. In a very simplistic price-action sense, a bottom wick on a candle can be an indication of rejection of a certain price level and perhaps some type of directional reversal. If it happens multiple times, it gives even more validation to the potential of that happening. The 4:35 candlestick formed a six-pip bottom wick; the 4:40 candle was a doji (a directionless candle with little to no body and is another strong indication of potential reversal); and the 4:45 candle formed another strong bottom wick. So on the open of the 4:50 candle – 0.92582 – I took a call option and saw it win by about three pips.
This was a bit of a different trade for me and not one that I take very often. If you’ve followed my trades for some bit of time, you’ll notice that I’m always searching for trades that center around price levels in the market that I’m looking at ahead of time. But this was basically a pure price action trade. Indeed, there was formation of a support level here, but almost always I’m looking for trades after a support or resistance level has already been formed. Even though it was an atypical trade for me, it’s still about using your best judgment to take set-ups in which the probabilities play in your favor of winning a given trade.
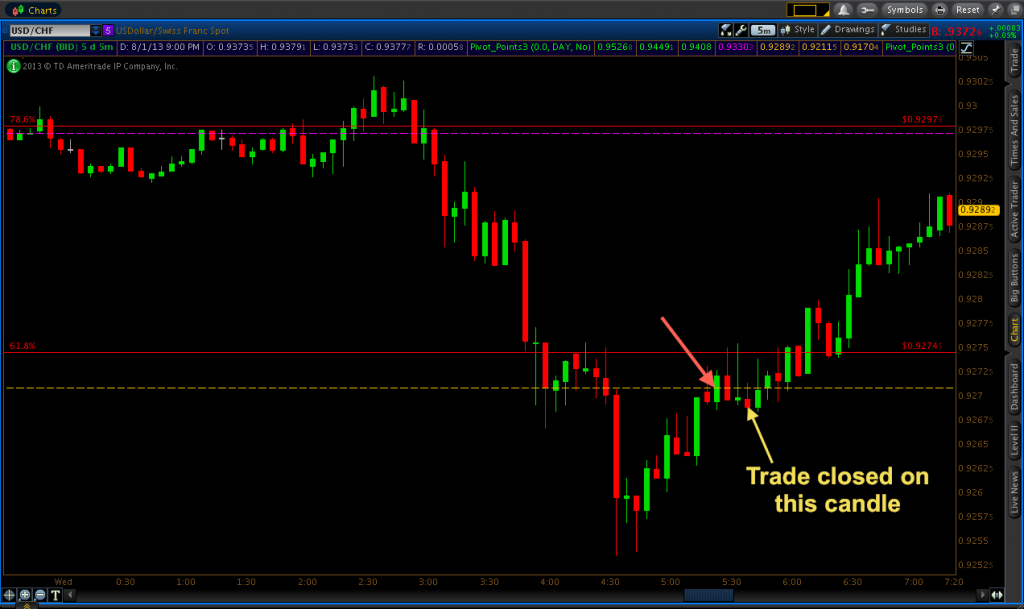
My final trade of the day came on the 5:25 candle at the touch of the support 1 level at 0.92708. Price had come up and rejected the level on the 5:20 candle, so I took the subsequent touch on the 5:25 candlestick. I felt that support 1 could be a decent level for taking a put option trade. Price had shown a lot of sensitivity to the level at around 4AM and just after. Therefore, I expected that it could act as a resistance point in the context of an overall downtrend (both short-term and long-term) on a retracement back up. It turns out the 61.8% Fibonacci retracement would have been a better choice for a put option set-up. This did spend quite a bit of time out-of-the-money during the early part of the trade, but eventually the resistance levels and overall downtrend prevailed and I won by two pips. I was definitely happy to win all five of my trades on five quality set-ups.
Obviously, there is no set-up that will absolutely guarantee that you win 100% of the time. But I do win about 75% of my binary trades, on average, for the simple fact that I trade conservatively and only take the set-ups that have roughly those odds working in my favor. That’s also the reason why I often only find a trade once every two hours or so. You never know how the market will act for certain, which is why it’s imperative that you do not overtrade. Naturally, it should be a rare situation where you have enough evidence in front of you to be making an educated guess about where the market should head. I have little idea the vast majority of the time, which in turn is why I’m not in a trade the majority of the time. This holds even more true when trading binary options at offshore brokers, in which the risk-to-reward ratio in a purely monetary sense isn’t as favorable as other forms of trading might give you. Therefore, maintaining a high winning percentage can be crucial.
It’s something I had to learn the hard way after blowing out several of my first trading accounts, and losing pretty decent sums of money in the process that I shouldn’t have even been trading in the first place. But gaining experience is absolutely critical in helping oneself become a profitable trader. I haven’t actually been trading for that long (just over two years), but in that time period, with some interludes due to things that get in the way, I’ve had nearly daily exposure to the markets in some form or another. By this point, I’ve spent well over 1,000 hours just sitting down and trying to watch and learn how markets work, particularly forex markets.
So if you are relatively new to this game and you have yet to become consistently profitable, there’s definitely no need to despair. Even the best traders in the world were not profitable right off the bat. Never expect results right away. Even if you’re hovering around break-even after a couple years, that’s actually pretty good. Trading takes a lot of time and effort to become good at, just like any other complex skill.