Understanding Asset Class Relationships
It’s called Intermarket analysis, and it is the study of how various asset classes interact with one another.
Excluding assets such as art or real-estate holdings, we have five major “financial market” assets classes:
- Cash and cash equivalents, such as T-Bills or CDs
- Fixed Income products such as bonds or Treasury notes
- Currencies such as the US Dollar or British Pound
- Commodities such as silver, coffee and lumber
- Equities, trusts and ETFs trades on stock exchanges
There are several basic relationships between these asset classes which can be used for analysis, or to find trading opportunities.
During an inflationary economic period, like from the 1970’s to late 1990’s, you’ll typically see the following relationships:
- Bonds and stocks move in the same direction, with bonds typically altering course before stocks.
- Commodities and bonds/stocks move in the opposite direction, with commodities changing direction after stocks.
- Commodities and US Dollar move in the opposite direction
These are general guidelines and over the short-term may not hold true. Also notice that bonds and stocks will often move together, but that bonds turn first. That means for some time bonds will be moving one direction while stocks move another. Also, since (bonds then) stocks turn before commodities, you may see periods where bonds, stocks and commodities are all moving the same direction.
Consumer and producer prices aren’t always rising though (inflationary period), economies also face deflationary times, and the relationships are different during such periods.
The relationships are the same except that stocks and bonds move in opposite direction. A deflationary period has been in place much of time since 1998 till now (2014), and stocks and bonds have for the most part been moving in opposite directions.
Here are the basic relationships in a deflationary period:
- Bonds and stocks move in the opposite direction
- Commodities and bonds move in the opposite direction
- Commodities and stocks move in the same direction
- Commodities and US Dollar move in the opposite direction
Figure 1 shows these relationships as they have played out since 1999 (click to enlarge).
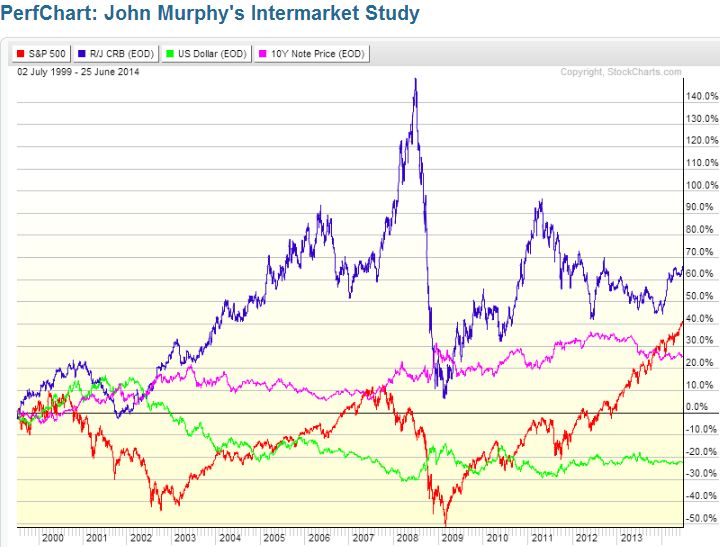
Source: http://stockcharts.com/freecharts/perf.php?[IM]
At times these relationships are very clear and at other times they may seem disjointed. This is because all the markets are based on perceptions, which can change very quickly.
It is also important to note that we are not just looking at the major trends, but rather comparing peaks and troughs. From 2010 to 2012 it appears that stocks and bonds are both moving higher, and they are, but during the trend, when bonds are rising, stocks tend to decline, and when stocks rise bonds tend to decline. If two markets are supposed to move together, one could even be in a downtrend and one in an uptrend; it is how the waves of one asset compare to the waves of another. That said, if assets move together, generally they will move in the same direction.
These concepts can also be applied to the cycle that all economies go through, which involves expanding and then contracting. This chart below is idealized; it reflects how assets act in a neutral market environment, without major inflationary or deflationary forces affecting assets.
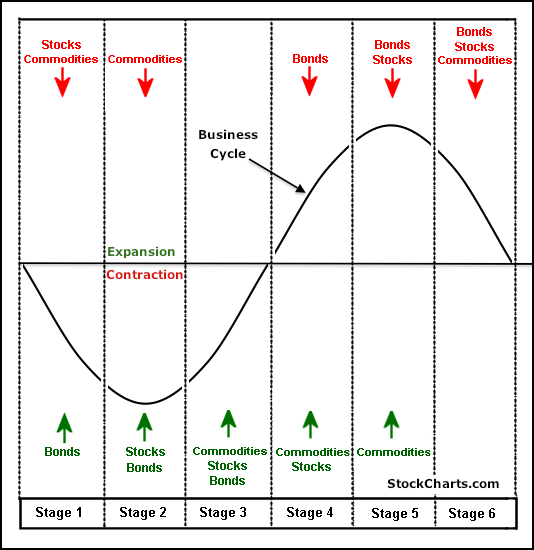
Source: http://stockcharts.com/school/doku.php?id=chart_school:overview:intermarket_analysis
Final Word
Even understanding a little bit about intermarket analysis can help you keep your wits about you in times of panic. Realize that money flows somewhere; when the sky is falling in one asset, that money is being diverted to another. The moves may not always be proportionate though.
Trading off this information can be difficult, since these are tendencies and in the short-term the relationships may break down. Also, there may be small periods of inflation or deflation within longer periods of deflation and inflation respectively.
By looking at the overall picture, you can generally see if something is askew though. For instance, in an inflationary environment when bonds and stocks have been rising together, and then bonds enter a downtrend while stocks are still rising, you should consider yourself alerted that the rally in stocks may also end soon.
Use intermarket analysis as a confirmation tool. You wouldn’t want to begin shorting stocks in mass until bonds have definitively turned lower, and stocks actually begin to trend lower as well.