Trend Extrapolation–A Common Novice Trader Error
Trend extrapolation is when you assume a current trend will persist, and thus make predictions out into the future based on the current trend. Now sometimes this can be good, for as we have all heard” The trend is your friend…until it bends.” And trends do inevitably bend the other way. I prefer to trade in the direction of the trend, but simply assuming a trend will persist because it currently exists is foolish. So while the trend is our friend we also need to realize it won’t last, which means we need to be picky about what trades we take, when we take them and what may affect our trades on other timeframes.
The Problem of Trend Extrapolation
First, let’s look at how inaccurate predictions can be if we only look at the trend that is going on in the immediate moment of our prediction. In 1970 if you looked at communist China almost no one would have believed China would begin to break from that mold and become a global superpower within a couple generations.
In 1963 a house call from a doctor in the U.S. was about $20 and accessible to the vast majority of citizens. Today many U.S. citizens can’t afford healthcare and costs have skyrocketed leaving many people completely outside the health care system. The trend in place in 1963 was for that time, it didn’t provide predictive value about the future.
If you look at a finite moment of time, and try to project that out into the future, you are likely to be wrong. Same concept applies to trading. If you pull up a 5 minute and the price is rising, you can’t just assume the price will keep rising. There are other factors at work, longer-term trends and traders taking profits or entering positions at different levels than you are not even aware of from looking at your 5-minute chart.
Set Parameters
So the immediate trend may not tell us all we need to know about taking good trades. If that’s the case, we need to set ourselves parameters for what we should be looking for.
If we are day traders and looking to only take trades that last between 1 and 20 minutes, then looking at a daily chart probably won’t help us much. But looking at the bit longer trends on a 4-hour or hourly chart is likely relevant. It will give us the bigger picture of current trend and provide some general ideas for places to take trades, and in which direction.
We can then drop down to lower time frames to find our exact entries so we can trade the shorter-term trends.
Zeroing In
A lot of traders get confused on which trend to focus on. If you mark the big overall trend on your longer-term chart, then you can also mark the shorter trends within that big trend (same chart).
The direction of the shorter trends provides you trade direction, assuming it still has room to move based on the overall trend.
Here’s what I mean. Figure 1 shows a 4-hour AUDUSD chart. I have marked the Big Uptrend sloping higher, as well as a current Down Channel moving down within the Big Uptrend. In this case, I want to be focusing my efforts and waiting for short trades based on the current Down Channel.
Figure 1. AUDUSD 4-Hour Chart (click to enlarge)
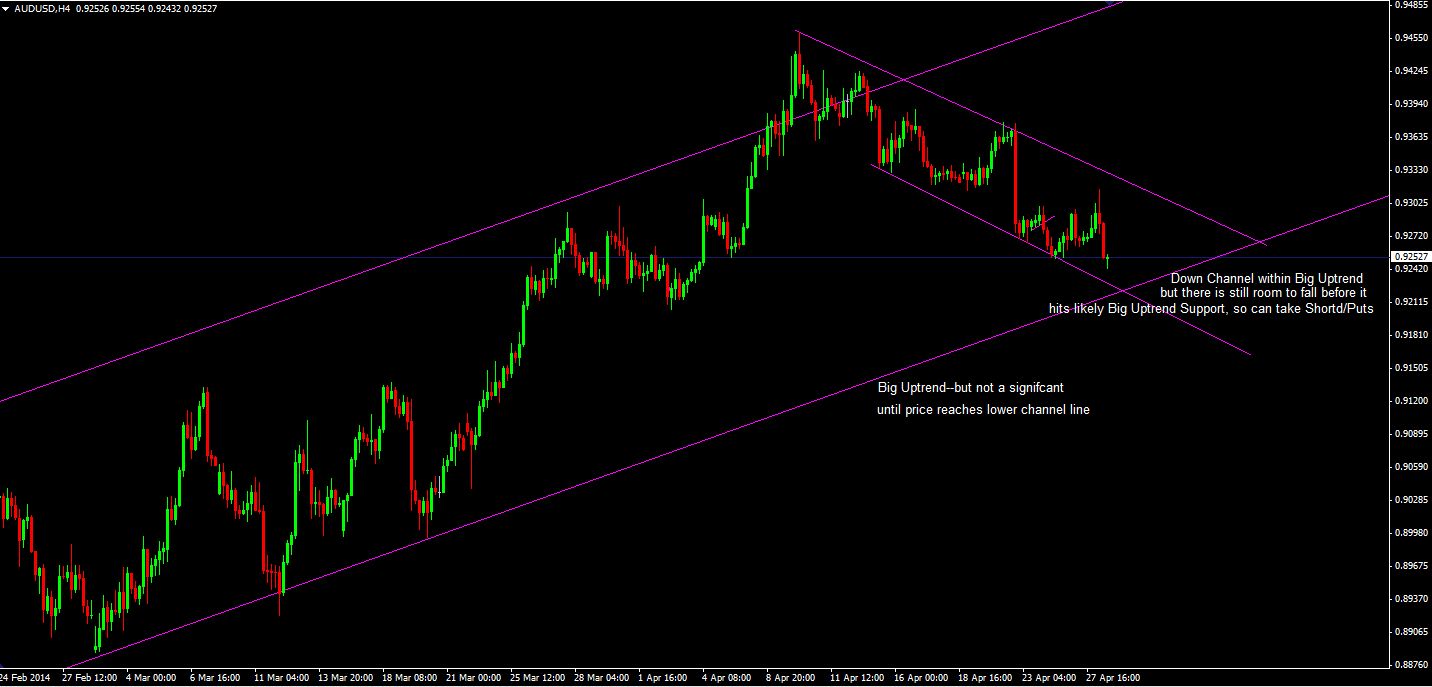
BUT, I must also take into account the Big Uptrend. The price is getting close to potential support (see: Understanding Support and Resistance) offered by the Big Uptrend, although there is still some room to the downside before that happens.
Therefore, when I drop down to lower time frames I am looking for shorts/puts, but I must realize that if the price drops much further the odds of the price bouncing higher begin to increase the closer the price gets to that potential support level.
In figure 2 we can still see our longer-term trend line is still a ways below the price. So we wait for the price to give us a shorting opportunity. When the price makes a strong drop and a lower low we have such an opportunity. Some potential trades are shown on the chart.
Figure 2. AUDUSD – 15-Minute Chart (click to enlarge)
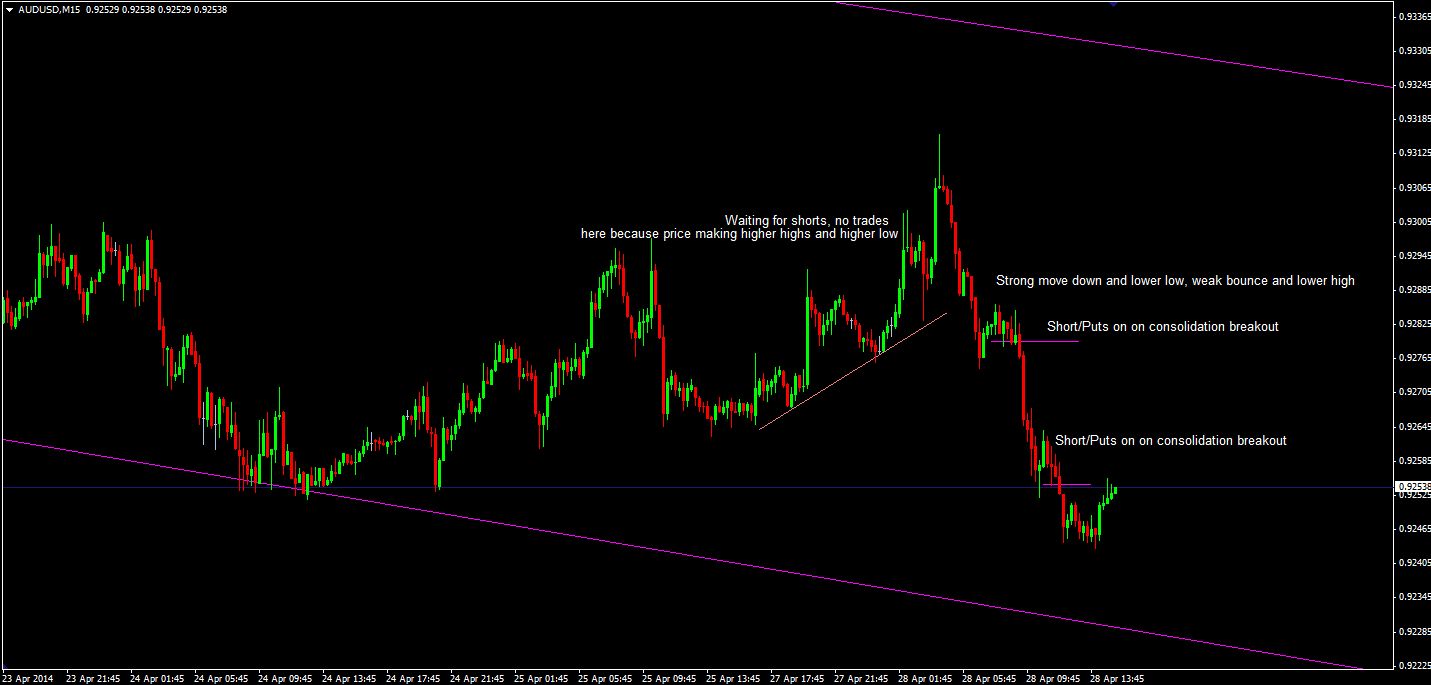
It is also worth noting that since the Down Channel is quite wide, if the price bounces off the lows of the channel and then progresses to make a higher high and/or higher low, you could also take some long trades (inside the Down Channel), since there is enough room for the price to rise within the Channel. From the 4-hour chart though we can see that price didn’t always make it to the top of the channel on a bounce, so if you want to take these trades against the current down move, realize that you may not have as much room as you think. In other words, tread cautiously.
Other Time Frames
Everyone trades a bit differently. If your trades last a minute or two then the 15 or 30-minute may be your long-time frame, with the 1-minute chart providing your entries. If you are a swing trader with trades that last a day or more, then the 4-hour or daily chart is useful for your longer-term and a 15-minute chart is likely appropriate for entries.
Final Word
Don’t just assume that what is right in front of your eyes can be extended out into the future. There are always other factors at work. Monitor longer and shorter-term trends, and combine the information, to find trades where the price has room to run (in your favor) based on the information you’ve compiled.