Trading with the Percentage Price Oscillator (PPO)
Most traders have heard of the MACD indicator, but far less have heard of the Percentage Price Oscillator (PPO), also sometimes called the Price Percentage Oscillator. The two indicators are very similar except that the PPO has a couple distinct advantages over the MACD.
The Percentage Price Oscillator
Like the MACD, the PPO is an indicator based on how the 26 and 12 period exponential moving averages (EMA) are acting in relation to one another. When the PPO (or MACD) is moving higher, momentum is to the upside. When the PPO is moving lower, momentum is to the downside.
When the PPO (or MACD) crosses above the zero line (into positive territory) it means the 12-period EMA has crossed above the 26-period EMA, signaling a potential trend shift to the upside. When the PPO crosses below zero (into negative territory) it means the 12-period EMA has crossed below the 26-period EMA, and the trend may be reversing to the downside.
Another moving average is applied directly to the PPO itself to provide additional trade signals.
Trade Signals
The MACD and PPO are used for the same purposes, and have three main ways of providing trade signals and/or analytical insight.
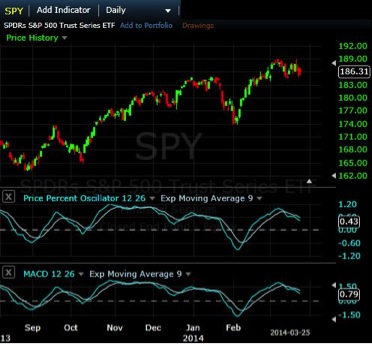
First, figure 1 shows the S&P 500 with both the PPO and MACD indicators–other than different values along the right hand side of the indicator (we’ll get to this in a second), the movements of the indicators are almost identical.
Figure 1. S&P 500 ETF with PPO and MACD
Traditionally the MACD and PPO have provided three basic trade signals.
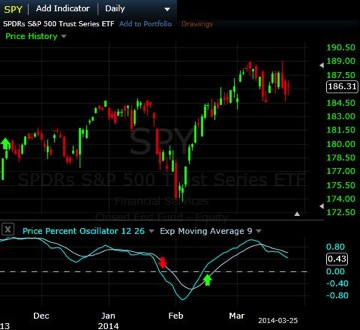
- Go long when the PPO (bluish line in figure 1) crosses above zero. Go short, or get out of longs, when the PPO crosses below zero. Shown in figure 2.
Figure 2. PPO Zero Line Crossover Trade Signals
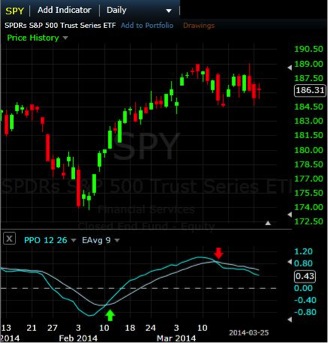
- Go long when the PPO crosses above its 9-day EMA. Go short when the PPO crosses below its 9-day EMA. Shown in figure 3.
Figure 3. PPO Crossing EMA Trade Signal
The third way to traditionally use the PPO is not really a trade signal. Rather it just provides a warning about a potential reversal of trend.
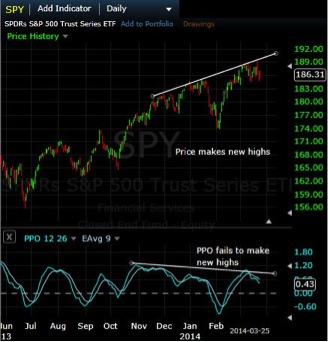
- Watch for divergence. When the price is making new highs, but the PPO isn’t, it warns a correction in price may be coming soon. When the price is making new lows, but PPO isn’t, it warns a rally in price may be coming soon.
Figure 4. PPO and Price Divergence
Why PPO is Better than MACD
Arguable, PPO is a better indicator than the MACD. PPO measures percentage movements, while MACD measures absolute movements. Since stocks vary in price, MACD readings can’t be used to compare one asset to another. With PPO you can compare assets. For example, if the price of one asset is rallying and reaches 4 on the PPO, you know that it is a stronger move than if another asset only reaches 2.
Also, when an asset makes a very large price move the MACD levels increase based on the rising price of the asset. This can cause divergence anomalies.
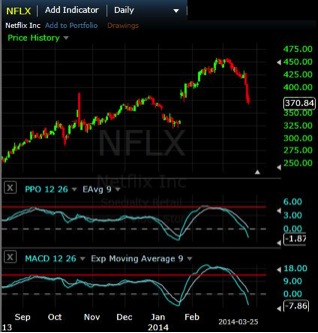
Figure 5 shows this in Netflix stock. As the stock moves up from about $250 to nearly $460 the MACD makes a major higher-high along with price (no divergence). The PPO, which is only concerned with percentage moves, doesn’t make a new high (divergence) and warns of the price correction which shortly followed.
Figure 5. PPO and MACD Level Comparison on Large Price Moves
It could also occur that the PPO makes a new higher-high or lower-low, when the MACD doesn’t. When this occurs, trust PPO.
Final Word
If given a choice between PPO and MACD, PPO provides a truer picture than the MACD of what is occurring over time. PPO is not skewed by large price moves (MACD is) and PPO also allows for direct comparison between assets. While assets may all have different prices, the PPO compares their percentage movements so you can quickly see which asset is stronger is weaker. If just looking at one asset during the day, the indicators are virtually identical, but if you want to compare asset strength or trade on longer-time frames, PPO is the better choice.