Trading the “Mini-Channel Breakout”
Watch a trend develop and you will see pullbacks along the way—brief counter-trend moves that quickly disappear as the trend re-emerges. Entering on these pullbacks can be lucrative, but most traders go about it the wrong way. They either enter too early when the pullback is still occurring–and then have to hope the pullback soon reverses–or they wait till the trend has clearly re-established itself, but by then much of the move may already be over. The following strategy attempts to solve these issues. While it won’t win every time, this simply mini-channel breakout strategy will help you get into trending moves early, but with a level of safety, since the breakout will signal the pullback has likely ended and the trend direction is re-emerging.
The Nature of Trends
A trend is not a relentless move in one direction; rather it’s a series of strong impulse waves in one direction separated by pauses or smaller reversals (corrections) in the opposite direction. Therefore a trend is composed of both impulse waves and corrections. No matter which time frame you trade on, generally you will see the market move in 3, 5, 7… wave patterns. A 3 wave pattern consists of an impulse, a correction, followed by another impulse. A 5 wave pattern is an impulse, correction, impulse, correction then an impulse. Tack on another correction and impulse for the 7 wave pattern. To some this may sound like Elliott Wave Analysis, it is not. No experience or knowledge of Elliott Wave analysis is needed to use this strategy, and no “wave counting” is required.
Look at a chart and with a bit of practice you will see every trend takes this configuration (figures below). Not rocket science, but upon this little insight you can base a powerful strategy. Each correction—which often appears to look like a mini-price channel–provides a potential entry signal to get into the next impulse wave of the trend. Such entries provide relatively low risk, profit potential and a plethora of trade signals each day, especially if you trade multiple forex binary options pairs or assets.
Mini-Channel Breakouts
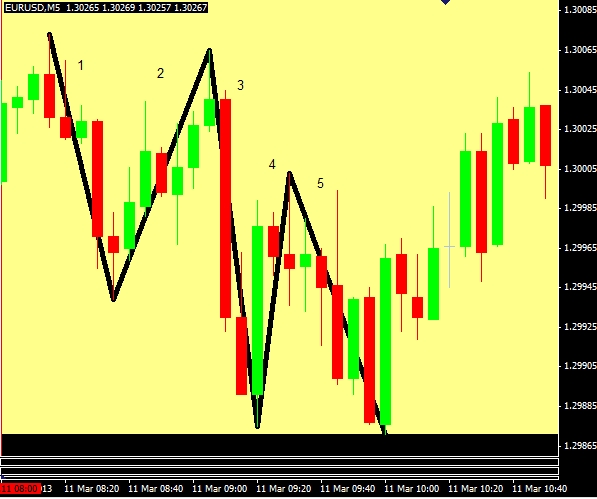
Figure 1 shows the EUR/USD from the open of the US session. From just after 8:00 till 10:00 a 5 wave pattern developed. I have highlighted it in black for demonstration purposes. The labeling with the numbers is not important, but is simply used to show how trends develop in impulse, correction, impulse… patterns.
Figure 1. EUR/USD 5 Minute Chart – March 11, 2013
 Source: Oanda-MetaTrader
So how does this help us? Since we know that most of time a correction is followed by a move back in the trending direction, we can look for corrections. As the correction is forming—bars start to move counter the former direction, such as in waves 2 and 4 above—we draw lines along the highs and lows of the correction to create a mini-channel (see figure 2).
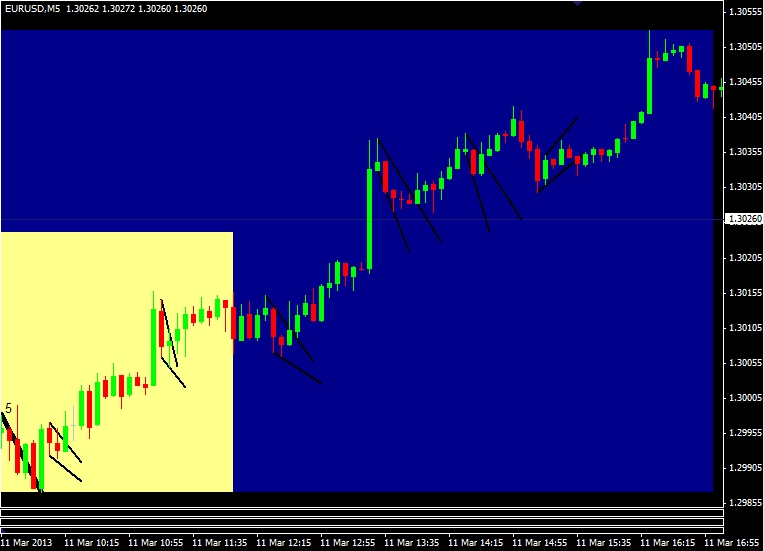
As the day continued on March 11 an uptrend developed (multiple waves), interspersed with minor corrections. I have marked some of these corrections on Figure 2 in black.
Figure 2. EUR/USD 5 Minute Chart – Trend with Mini-Channels
 Source: Oanda-MetaTrader
By drawing the mini-channels on the chart, we provide ourselves with a potential entry signal. In Figure 2, we have strong moves higher, followed by moves lower (mini-channels). When the price breaks back above the mini-channel a long/buy/call trade is taken. In a downtrend we have strong moves lower, followed by corrections (mini-channels) higher. A short/sell/put trade is taken when the price breaks below the mini-channel.
Unfortunately, not every breakout results in a sharp move in the direction of the former trend, and it is very possible to get false breakouts since the channels are small and we must draw them in real-time.
Drawing the channels can also be somewhat subjective. Comparing charts with another trader at the end of the day, it is unlikely all the mini-channels would be marked the same. Also, corrections may not always take the form of well-defined channels; corrections may be erratic, and not easily contained between lines.
Stops and Profit Targets
If trading binary options, you don’t need to worry about stops or profits targets. Rather simply make sure that the time frame you are watching corresponds to the time frame of the option you trading. For example, a breakout on a one minute or five minute may not do you any good if your option doesn’t expire for several hours. If your trades last hours, use a 15 minute chart. If your trades last minutes, use a one or five minute chart—or both.
The strategy for entries is simple—look for a strong move in one direction (impulse), wait for a pullback, draw a channel around it, then wait for the breakout to occur in the direction of the impulse. Getting in is only part of the battle though for those not trading binary options; you also need to control risk and plan for a profitable exit.
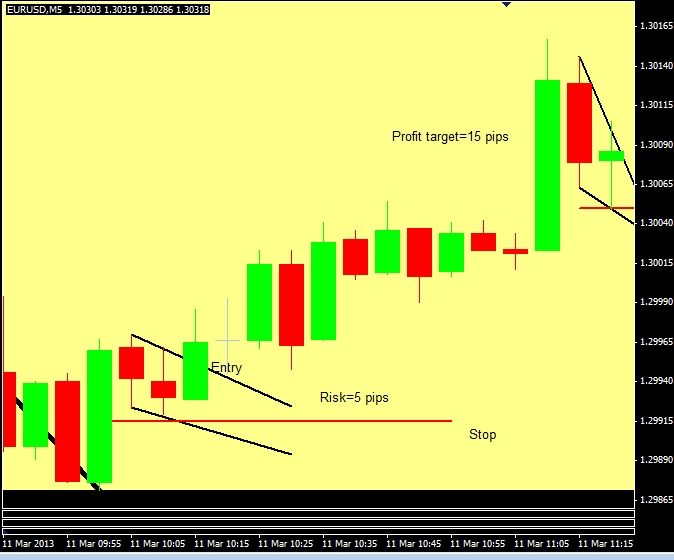
To control risk, place a stop just below the most recent swing low, prior to the breakout. Your risk is the difference between the entry price and your stop price. Set your profit target at 2 to 3 times your risk. For example, in an uptrend if you risk is 15 pips, place a profit target at 30 to 45 pips above your entry price. I personally set my profit target at 2X my stop. Figure 3 shows an example from the morning of March 11. The trade had a 5 pip risk, and therefore a profit target was placed 15 pips above the entry price.
Figure 3. EUR/USD 5 Minute Chart with Entry, Stop and Profit Target
 Source: Oanda-MetaTrader
This strategy provides many signals, and as trends end and new ones begin this is where losses typically occur. After some practice, attempt to filter out some of the signals using indicators or wave counts to avoid being on the wrong side of the market when a change in trend direction is likely.
Final Word
Markets move in a continual pattern of impulse, correction, impulse, and so on. Even when the overall price movement is confined to a range, you will typically still be able to see this type of movement. Yet, this type of strategy is best utilized when an asset is active and moving freely, and not confined to a range. When trends reverse, the impulse, correction, impulse patterns begins in the new direction. While the strategy appears quite simple in theory, in the real world it is more difficult to implement since you must constantly be determining the direction of the trend, and whether a correction is actually the start of the new trend. Use a demo account to practise isolating impulse and correction moves. Draw the mini-channel lines on the corrections and attempt to profit from the impulse waves that follow. While intra-day examples were used in this article, the technique can be applied to any time-frame.