Trading Gold at Markets World
I hadn’t done any gold trading for quite a long time, but back when Markets World first began tapering back their payout percentages from the initial 95% that helped to popularize themselves as a binary broker, gold was still one of the last assets to have 90%+ payouts. Even today, the payouts on gold are quite good and regularly hover above 80% and as high as 95%. And I also enjoy mixing things up with my binary trading. I almost exclusively trade forex currency pairs, but trading different assets, different expiration times, and on different brokers helps me to keep my blog more dynamic and hopefully appeal to a larger contingent of readers who all have their own trading preferences.
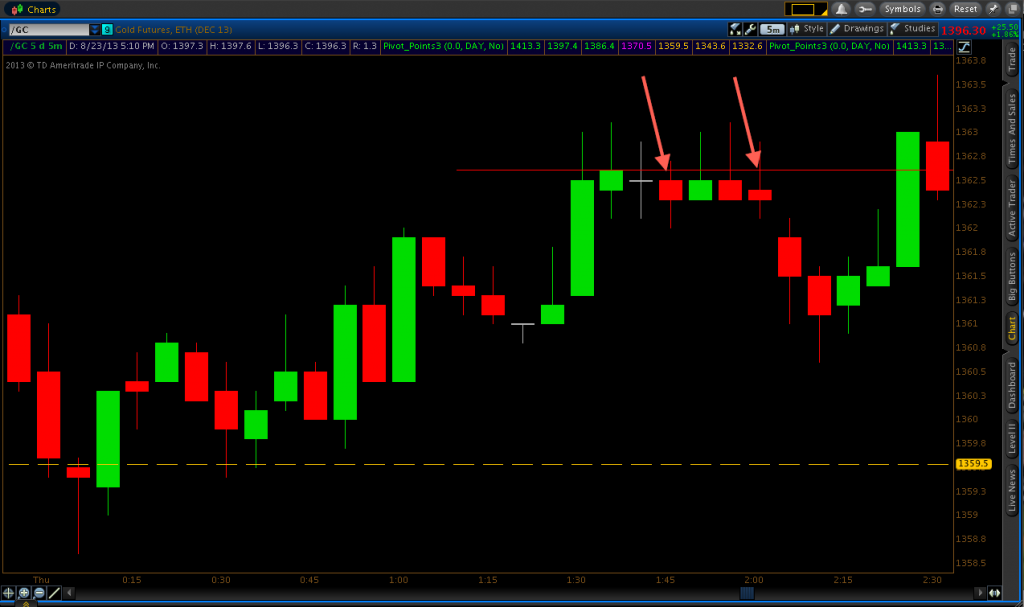
My first trade was similar to one of my USD/CHF trades from the previous day. Price came up to 1362.60 and consecutively wicked three times in a row. When the market reaches a level and wicks at around the same price on three or more successive candles (usually valid on the five-minute chart or higher), chances are the level will hold at least in the short-term and you’ll be able to get in a winning trade with a small time expiry.
Once three consecutive wicks formed at 1362.60, I got in a put option on the re-touch of the level on the 1:45 candle. This trade won by just $0.10, but pre-2AM EST is very normally a low-volatility time period in the gold market and the 1362.60 resistance level held quite well. In fact, this level was holding so well that after six consecutive wicks at 1362.60, I decided to enter another put option, believing this would also serve as a trade with a high probability of working out. After I entered this put option, the gold market finally started to retrace back down and I ended up with a winning trade margin of $1.10.
After this small retracement, the market would come up and breach 1362.60 and meander above and below the level for about the next hour. The market wouldn’t make a significant move until the 4:00 candlestick, which saw about a $7.00 price jump and busted through the daily pivot in the process.
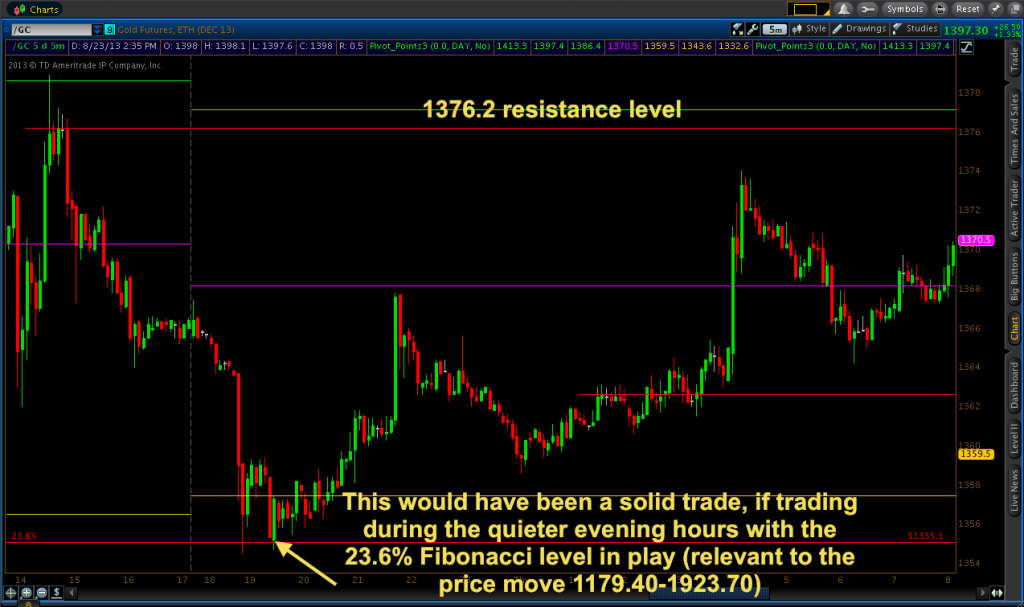
At this point, the two levels I had pre-considered for trading areas were potential call options at the daily pivot level of 1370.50 and 1376.20 for put options, which had been a resistance level created from the previous day’s high (see below screenshot).
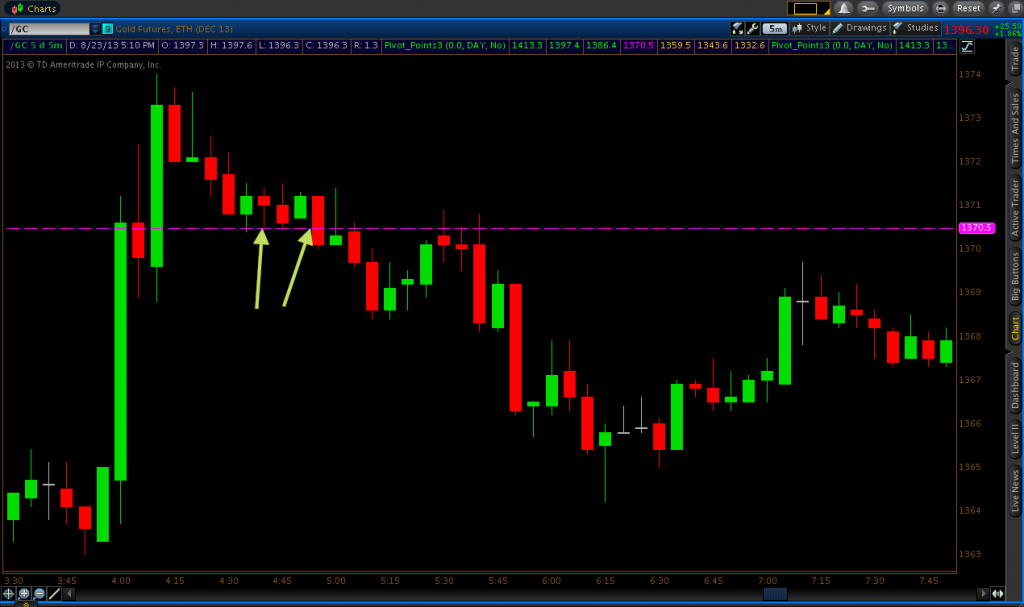
Price came down and re-touched the pivot level on the 4:35 candle, and 1370.50 was promptly rejected. So I decided to get in a call option on the touch of 1370.50 on the following candle, and was able to get a $0.10 winner by expiration. Being that the pivot was continuing to hold well and the trend was up, I decided to enter a subsequent call option on the touch of 1370.50 on the 4:55 candlestick. This trade, however, fell out-of-the-money by $0.20.
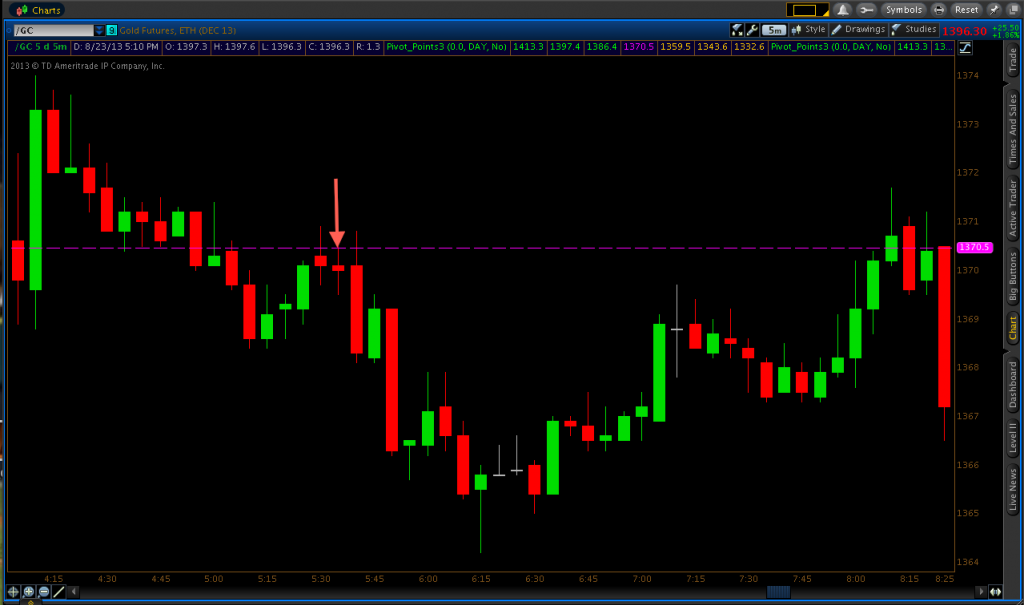
The market ended up breaching the daily pivot level to the down-side on the 5:05 candle. At this point, I had the pivot point targeted as an area for new resistance (being it had acted as support previously), although I had no call option targets in mind as the market had given no clear area of intraday support.
On the 5:30 candle, the market once again revisited the pivot and rejected the level. So following what I typically do, I got in a put option on the following candle once price re-touched 1370.50. This trade won by $2.20.
Once price got back up to the pivot on the 8:10 candle, it went directly through it and breached it permanently twenty minutes later as U.S. jobless claims data were released.
I had stopped trading at this point. However, had I continued, the put option set-up at the 1376.20 level (resistance created by previous day’s high) would have been a nice trade to take. The price was rejected on the 8:35 candle, before re-touching on the 9:05 candle.

But I was still very happy with how this trading day went overall, with 4/5 ITM.
Note: Gold’s ticker symbol is listed as /GC on the above ThinkOrSwim charting software screenshots and it’s price is relative to the U.S. Dollar.