The Tenkan-Kijun Cross
Directional Trading With Ichi Moku
Ichi Moku, or Ichi Moku Hiyo Kinko, is an indicator created by a journalist in the 1960’s to help simplify market analysis. At first glance the Ichi Moku clouds are quite intimidating and hard to understand. The good thing is that it is actually a very simple indicator to use and very versatile. As he was not a mathematician and computers were not available as they are today the indicator is based on high and low prices of X periods. In fact, 4 of the 5 plots used to create the clouds and signal lines are based on high and lows. The fifth is based on closing prices. Today I am going to be focusing on only two of the lines, the Tenkan and Kijun lines. These lines are the two “middle” lines drawn on the cloud chart. The beauty of the Ichi Moku is it’s versatility. It can be used to define support and resistance, it is a trend indicator, measures momentum and gives signals. The translation from Japanese gives us some insight into just how useful; the one look equilibrium chart.
This strategy focuses on the Tenkan and Kijun lines in order to find trend following signals. It is used in trending markets and can be applied to any time frame. The recommended time frame is daily but hourly, 30 minute and 15 minute charts can be used with more active assets. The trend is determined by the cloud component of the Ichi Moku, whenever price action is above the cloud the trend is up and whenever it is below the cloud the trend is down. Signals are only taken in line with the trend, which is confirmed by MACD for added accuracy. Expiry is determined by the time frame used but is typically going to be 2-4 candles. For my example I am using the daily charts.
Signals set up is very important to get the best results. First, the cross of the Kijun line by the Tenkan line must be sharp and well defined. Weak crosses, or when the lines are trending together in a sideways fashion are not the best signals but may be a precursor to a much stronger signal. In addition the Kijun line needs to be moving up as well. Again, this is to ensure a strong signal and to help weed out bad trades. The trend component is defined by the cloud. When the price of the asset is above the cloud then only bullish signals are taken, when the price is below then only bearish trades. MACD is used to help confirm trend. MACD must be confirm trend for a strong signal but for the strongest signal MACD must be bullish AND on the rise for a call or bearish AND on the decline for a put.
Advantages Of The Tenkan Kijun Cross
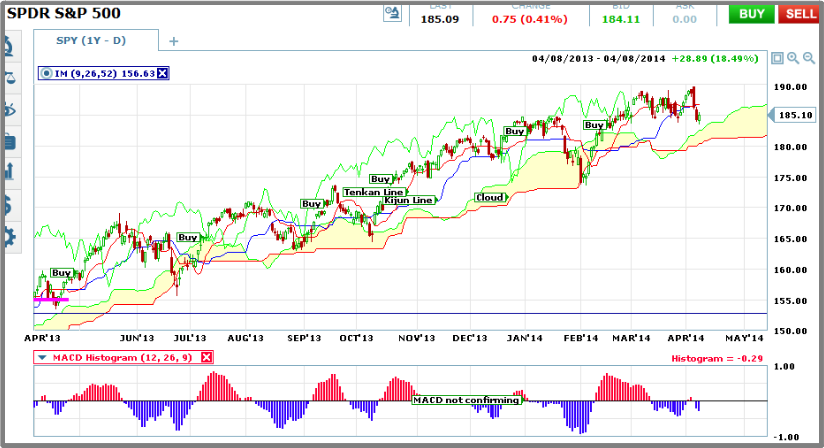
One advantage of this strategy is that it is not only a trend following strategy it is also a momentum strategy. The crosses are trend following signals but are based on increasing market momentum. Look at the chart where I have marked 6 entry points. Over the course of the chart price action is trending above the cloud so the trend is up and only bullish signals are taken. Each signal I have marked follows the cross, is confirmed by MACD and results in a winning trade. The thing to take note of is that most of these are strong signals and can be traded multiple times. Take the February 2014 buy signal. This signal results in a rally that trends higher for 12 days before hitting its peak. Once the first signal is taken additional trades can be made every day with a one to two expiry using a shorter time frame for entry.
Disadvantages Of The Tenkan Kijun Cross
The biggest drawback is that there will not be a lot of signals given, it takes patience to use this strategy. The good news is that signals that are given are usually very strong, and usually come with additional follow up signals. In a strongly trending market any retreat of price to the Tenkan line can be considered a potential entry point. MACD can also be used to confirm these signals as well. Look at the period between the mid-October and the early January buy signals. There are at 12 potential entry points for bullish trades. Using the maximum 4 candle expiry only 2 of them would have failed to profit in a binary trade. Another drawback to this strategy is that the signal is lagging. The very thing that makes the signals so good is also what makes it lag, momentum. The asset must be moving in order for the signal to fire which means that a large portion of the move and a lot of tradable entries are missed.