The Most Forgotten Indicator
Volume And Trading, Not To Be Discounted
Volume is a subject that most traders, especially new ones, fail to recognize. It is a very important factor in market movement and a key element of many if not most technical indicators. The volume, the number of shares, lots or tics traded in one day, session, week or month, is the number one way of identifying how much interest there is in an asset. The more volume the more interest and vice versa. Volume can be used in a number of ways but perhaps the most useful is a tool of confirmation. A break above resistance on high volume has more chance of succeeding than one on light volume. Likewise, a long legged doji that appears in conjunction with high volume is more likely to be a turning point in the market than one that appears on low volume. Volume is also useful for forecasting the markets. In a previous post I talked about seasonality in the marketplace and how that can affect volume. If you know that an upcoming season is likely to have more or less than volume you can adjust your strategy to suit.
The most basic form of volume indicator is simple volume. Simple volume is a histogram that appears at the bottom or below most charts and is nothing more than a count of how many shares, lots or tics were traded for the chosen settings. This can range from minute to minute all the way up to monthly data with most charting packages, the ones that count anyway. The caveat here is to know what you are trading and how volume is counted for that asset. Things like stocks, ETF’s and other securities are sold in physical form albeit electronically so it is possible to count actual volume. When you use the volume indicator for stocks like Amazon, Facebook and JP Morgan it is counting the actual number of shares traded for that day. Depending on which package you are using and how you have it set up volume could be the number of shares traded during the open session or include shares traded in the pre and after market sessions. Some assets such as commodities and futures are traded in lots so when assessing a chart of these prices volume is counted in this way. Lots can range from things like one hundred ounces of gold to bushels of corn, barrels of oil or bales of cotton. Now, in terms of things like forex which are traded around the clock in a wide number of forms there is usually not an actual volume that can be tracked. Some platforms do not provide any data for these assets while others may count it on a tick basis whereas each tick represents a trade and is counted as such. This can be useful but not as reliable as actual volume.
Volume has a big impact on market direction.
How To Use Volume As An Indicator
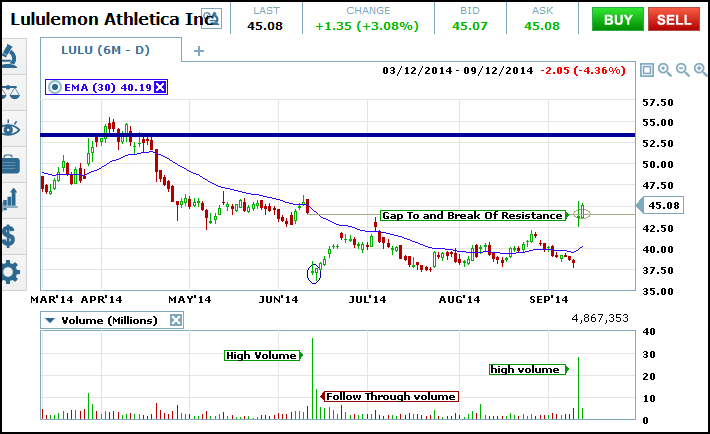
Trading volume can be used as an indicator and trigger for trading. The most commonly used methods are to look for spikes in volume and increases in volume over time. A spike in volume is simply a day in which volume is noticeably higher than in previous days. This is caused by a wide variety of factors but signal a day in which traders were actively buying and selling the asset. If the candle or bar formed is a bearish one then you can say that a high volume of sellers outnumbered a low number of buyers and pushed prices lower. The same is true in reverse, a green or white candle signals that a high number of buyers pushed prices up. Typically traders will track a 30 day moving average of volume and use that as a filter for trading. Only spikes that are 2, 3 or X times the 30 day moving average of volume are counted. This kind of information is readily available on most websites that keep data and information on the stock market such as CNBC.com, YahooFinance and MSN Money if your own platform or broker does not have it. This same method can be used in a longer term framework as well. If average daily volume was X for the last week and then slowly moves up to 1.5X and then 2X over time you can be sure that more interest is building in the asset and apply that knowledge to your trading decisions.
Some Thoughts On Volume
I am a fan of volume and other studies that take volume into account. Price action can give you a decent signal but if the market is not behind it then it has a lot less chance of succeeding Using volume is a great way to help determine the good moves from the bad. Even more important than the volume that occurs on a signal day is the volume that happens on the next day and the next. If high volume continues then you can be assured the move will continue. The caveat is that not all assets or even platforms count volume in the same way so it is important to understand what you are looking at. Further, volume, like all indicators, is not infallible. You have to use it alongside other indicators in order to make the best of it. Additionally, there are plenty of great tools that use volume as the basis of their study such as Volume Flow Indicator to use as well.