The Kumo as an Oscillator
In my first post I talked about an ichimoku component called the Kumo. Typically the Kumo along with the other components of the system are used to define & trade trends. Price inside the Kumo is considered to be consolidation, above is bullish & below is bearish.
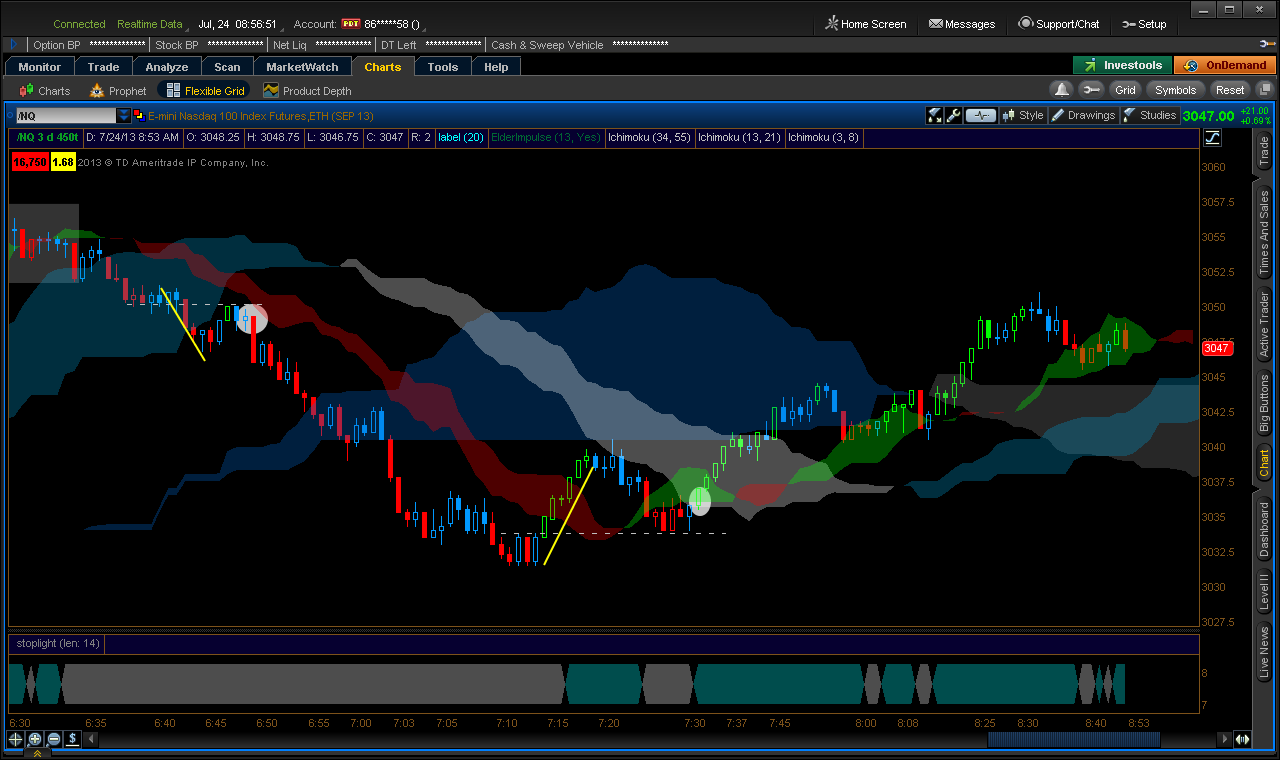
In the picture below price is displayed as 450 tick candles and there are three Kumos – (55,34) (21,13) & (8,5). Price tends to oscillate through the Kumos and they tend to point out good trade locations and targets. I’ve circled two great trade locations from this morning just after the Chicago open. The first is the beginning of a trend defined by the break of the middle Kumo & the second is the reversal of that trend.
Just to reiterate from the previous post, the reason these levels often work as support, resistance & trend indication is that they are composed of midpoints of ranges & price tends to respond to midpoints of ranges, especially in moving markets.