The Cup and Handle Chart Pattern
The Cup and Handle pattern is quite common, and once you practice spotting it you will likely find it in all different markets and on many different time frames.
Cup and Handle Chart Pattern
The cup and handle is a bottom pattern where the price initially declines, then levels off and begins to rise again, creating a rounded cup-like appearance. The handle can be a sideways or declining price channel that occurs near the “lip” of the cup.
When the price breaks above the handle it indicates a continued move higher.
The following examples use stocks and daily charts, as the cup and handle is most commonly discussed in regards to stocks and daily charts, but as indicated the cup and handle can be found on all markets and time frames.
Figure 1.
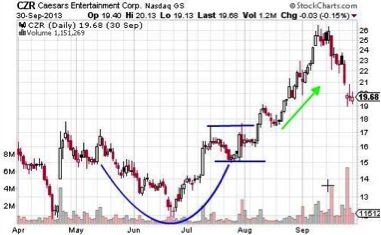
Many traders look for a very rounded bottom–a “U”– and not the “V” like formation what occurs in figure 1. The “V” actually shows a strong shift in momentum, which I find favorable compared to a slow moving rounded bottom. It should be noted though that the cup and handle is based on rounded bottoms, so a V-type formation isn’t technically a cup and handle pattern, but is still very tradable.
Not Always Pretty
The pattern doesn’t have to be pretty to be effective. Basically were looking for a down move, followed by a move of equal magnitude back to the upside and a pause near the highs of the “cup.” Whether that occurs in a beautifully rounded symmetric bottom or a choppy and unattractive bottom doesn’t particularly matter to me. Figure 2 shows an “unattractive” cup and handle pattern, yet it is still effective.
Figure 2.
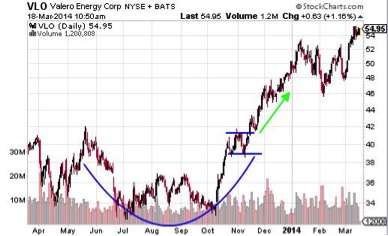
We see a sharp down move, followed by a sharp move higher of nearly the same magnitude. There is a pause (handle), which is drawn in a small channel. When the price breaks above that channel (handle) the move higher continues.
Trading
The classic approach to trading this pattern is to draw trendlines around the price movements of the handle. When the price breaks above the handle, enter a long position. Place a stop loss below a recent swing low and set a target. I will typically use a Fibonacci Extension to provide a general guide on target placement.
When a V-shape bottom occurs, the right side of the pattern often resembles a flag formation, and can be traded as such.
Pitfalls and Considerations
One downfall of the pattern is that while it is common to find cup and handle patterns that worked out, we also find many examples that didn’t work out. This is typically why traders wait for the price to break above the handle before going long.
Also, the handle shouldn’t be bigger than 50% of the cup formation. Typically it should be smaller than 50%.
If we look back at figure 2 there were a number of other (what some may interpret as) cup and handle patterns, yet for various reasons we wouldn’t have traded these.
Figure 3 shows a few examples. In the first example (left), there is no upside breakout. Also, this pattern doesn’t have a rounded bottom and appears more to be an inverse head and shoulders pattern–this pattern utilizes a different entry point.
For the example in the middle, the pullback (handle) is too deep, retreating more than 50% of the cup.
In the third example there is only a brief pause near the cup rim, but not a handle, making it difficult to establish an entry.
Figure 3.
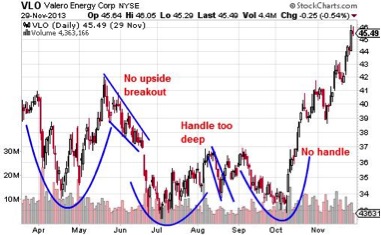
We must also look at the overall price action to determine if a cup and handle should be traded. The three examples in figure 3 don’t show a major change in direction–just a small ones.
Figures 1 and 2 show much larger patterns, so when it breaks it indicates a major shift in trend has begun. Since this is a bottoming pattern it should be relatively large, having created support levels on its way up to forming the handle. This helps establish the price has actually reversed another leg higher is coming once the pattern completes and the handle breaks.