Success With Price Action Trading
Hello everyone, I’m back finally after a long Christmas and New Years break. I hope that everyone had a wonderful Christmas and a great start to the New Year! While I was away I was reading up extensively on Price Action, in particularly Al Brooks books on price action (they finally came in!). I am nowhere near done reading them, they are huge books, and not the easiest ones on the shelf to read…..by far. Those books contain so much detail about Price Action I feel like I’m sifting through a forest made of mud. Sometimes I have to re-read a page to grasp what was said, and I may read all three of these books over again just to let it sink in. They are hard to read, but they are the best source of what price action is to me. I will be applying some of the concepts from those books in my trading, and I will do it as I read the books, so bear with me it may take a while.
So lets have a look at what I did today, this is the first day I started trading since I stopped when the markets were getting a bit crazy and scarce. One thing I do not do is trade during December; everything just seems sporadic to me so I stay away. Plus it gives me time to focus on family and friends; otherwise my head is stuck in the books lol. Anyways I made four trades today, and three of them were ITM. I am trying to make my trades as simple as possible, no need to be super technical about it, because I’ve tried many strategies with crazy chart setups, colors, bells and whistles, and I find it just distracts me from what’s really happening. I have made a slight modification to my charting setup, nothing big really, just I changed and added an extra EMA to the chart. Those EMA periods are 180 and 365, and I chose those because it gives me the bigger picture of the trend on a smaller time frame, and also price seems to treat the EMA’s as Support/Resistance.
My first trade was with EUR/GBP, and I watched as price bounced a couple times off the 180 period EMA, so I waited for it to approach the EMA again. Once it reached it again I waited for some other form of confluence. We can see that the overall trend was down, and there was a bearish inside bar that formed after the candle that reached the EMA. To help things out further the Value Chart was at the 106 level which also signaled a possible overbought situation. Keep in mind everyone, it may sound like a lot, but it’s easy for me to see all of these hints and it takes me just a couple of seconds to decide. I placed a Put with a 10Min expiry and it was about a 4 pip win.
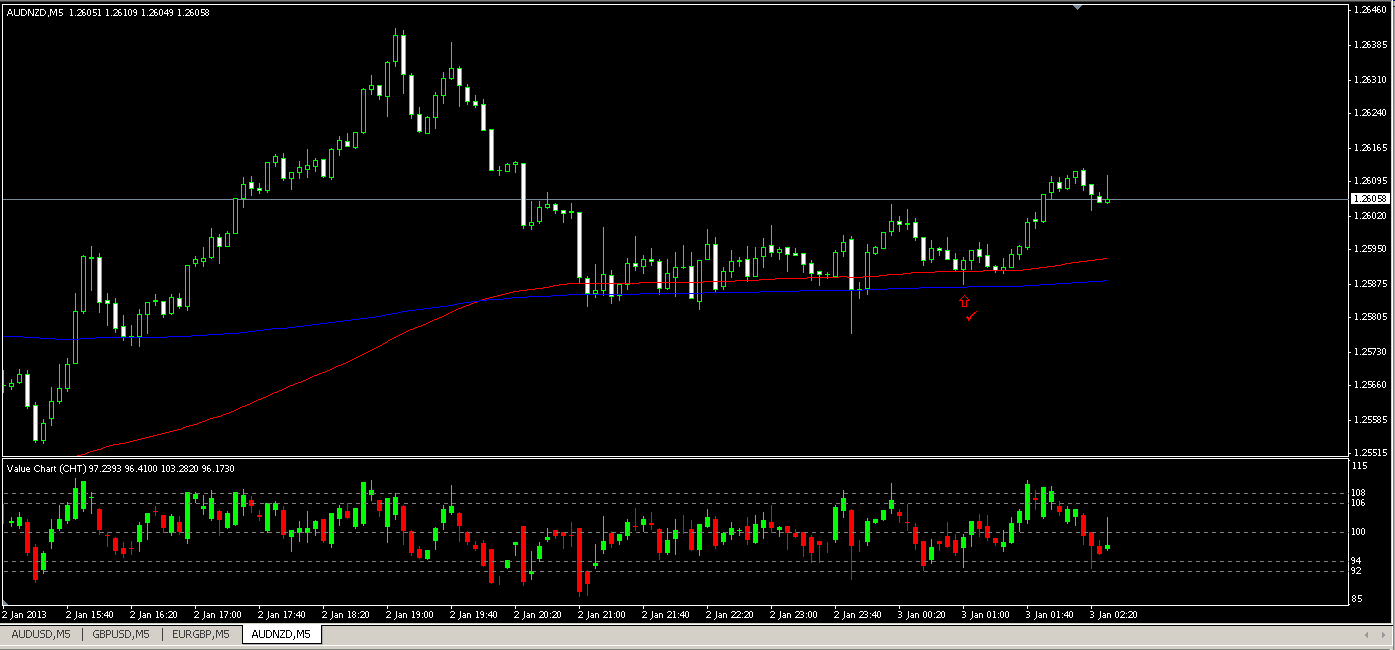
My second trade was with AUD/NZD. This is the first time I have traded this pair, so I’m not that familiar with it. But I did find confluence and adequate PA to trade it. Here price was reacting to the 180 and 365 EMA, so I waited until it came down and touched one of them. It did and shortly after there was some rejection of that level, and also a pin bar formed, which I highly value. The trend was also changing direction to the north side and the Value Chart had just dipped down below the 94 level, signaling to me a possible oversold situation. All of these gave me enough confidence to place a Call on the 10Min expiry, and ended up ITM by almost 2 Pips. It wasn’t the best win, but price did respect the EMA.
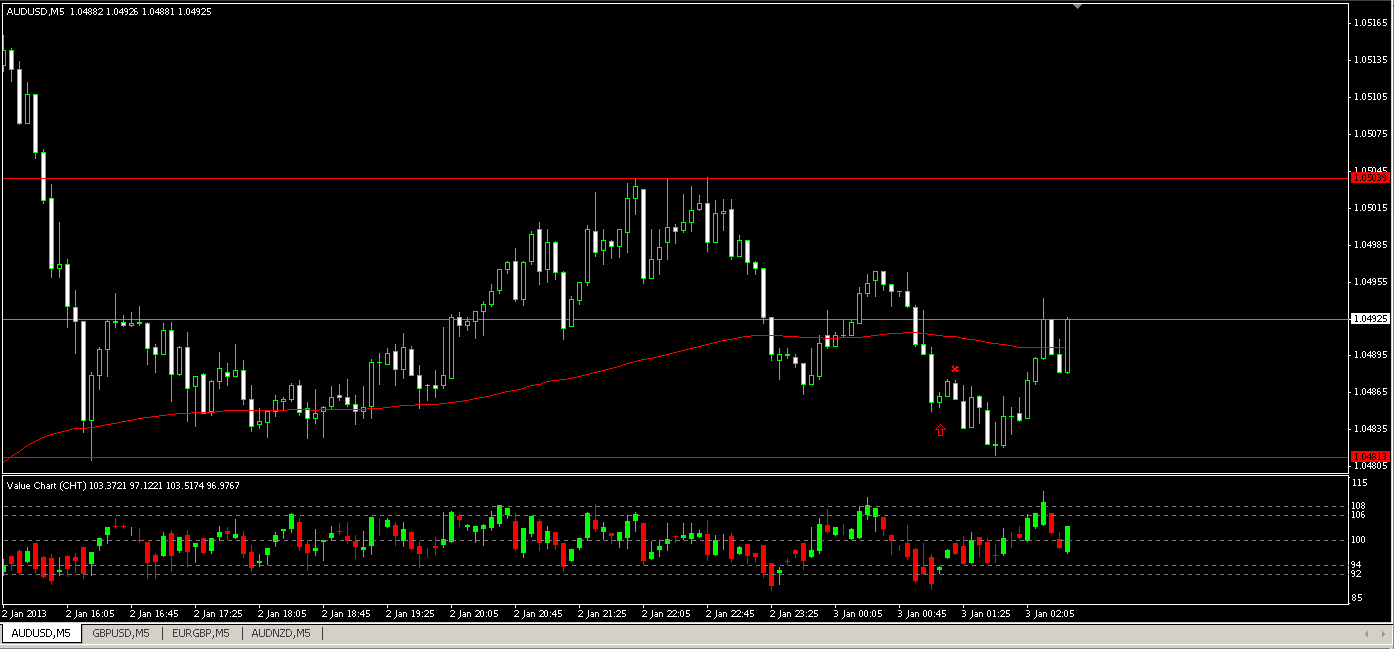
My Third trade was with AUD/USD, and I didn’t win this one. This trade I should have just threw out the window, because I didn’t have all of my criteria met to take this trade, yet I did anyways. I’m still working on my patience, sometimes I get antsy looking for a trade, and I DON’T need to do that, I need to let the market come to me. The only thing I really had going here was there was a small bullish inside bar, and that’s about it. Remember folks, follow your rules.
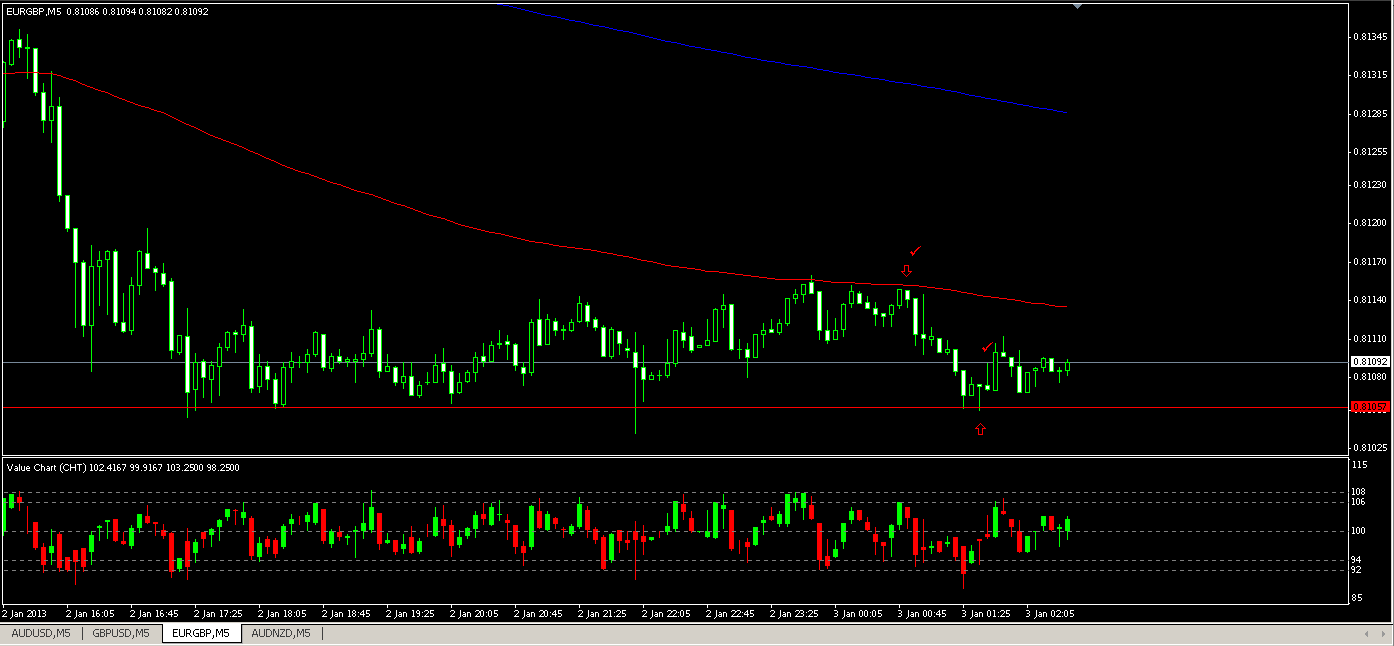
My fourth and final trade was back with EUR/GBP. It was ITM by about 4 pips as well. My reasoning for this trade was because price was continuously being rejected around .81057. I waited for price to come down and reach that level again, and see if it was going to push though. After price reached that level, it had more rejection, in the form of another Pin bar. I also had confluence from the Value Chart as well as the fact the EMA’s were flattening out, signaling the downtrend was slowing to range for a while.
Well, that’s about it for today, I hope everyone enjoyed my explanations of my trades. If you have any questions please ask!