KISS – Keep It Simple Keep It Stupid!
3-4-13
Hello traders, hope today was good for you. I took the last week off because I had to study for a promotional test at work. Monday is usually a slower day for trading, just not quite as much volume as the middle of the week. Some of my usual pairs had either recently had important news, or were just not moving like I would like them to. I eventually settled on GBP/USD for my trading today as it was fairly reliable and was easy to read. When I trade I do not make things complicated, I like to employ the K.I.S.S. method (Keep It Simple Stupid), because if you use too many indicators, you cant see the big picture and most of the time many of the indicators wont agree in the direction of the trade and you end up with mixed signals and confusion. I believe if you find something that works for you, stick with it and don’t change. If it works why try to fix it. Even if you have some losing streaks, which everyone will have sooner or later, don’t change your strat, because it works most of the time. Nothing in trading is 100% successful. Many newbies will pick up a strat and use it until they have a losing streak, then they either modify the strategy or find a whole new strategy, and the vicious cycle continues.
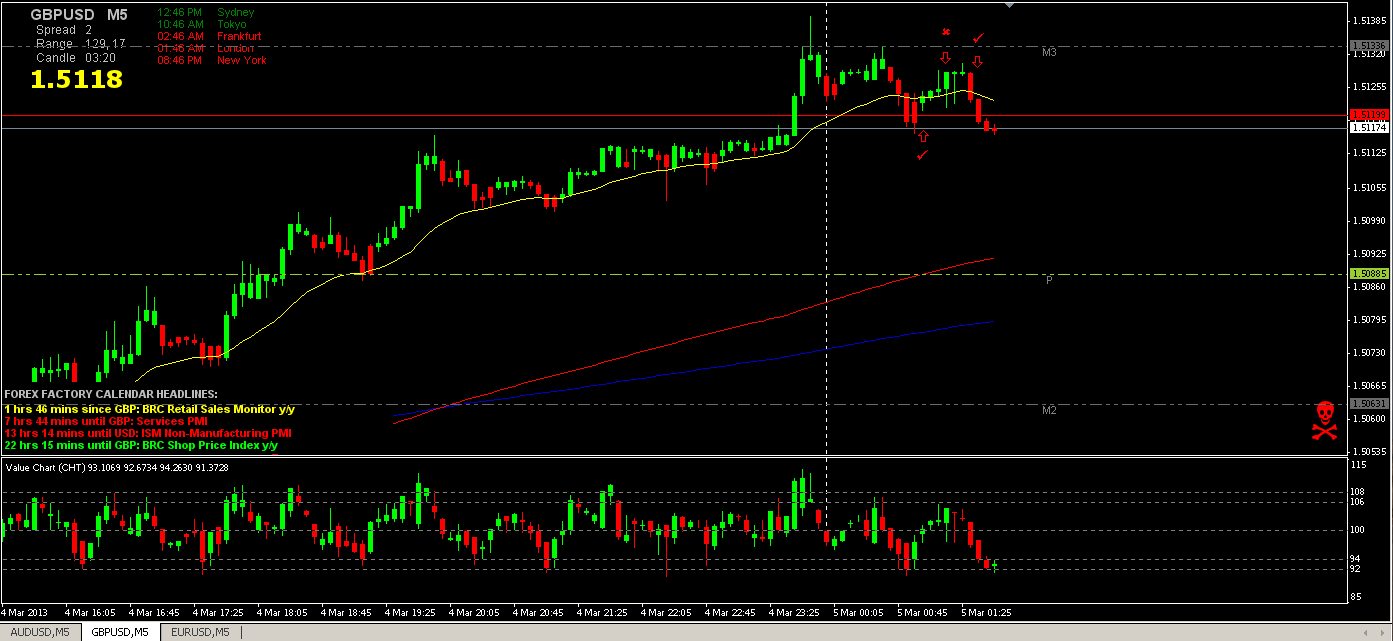
I made three GBP/USD trades today, and 2/3 were ITM, effectively giving me 66% ITM for the day. It seems my magical number of trades a day is 3, but that can vary from person to person. My first trade for the day I started off by looking for any important news that recently came out or was about to come out, and since the very important news wasn’t for several more hours, I didn’t have to worry about planned news making the market wacky. So I began to look at the overall trend direction price was heading, and in this case it was up. I waited for price to make a pullback, but something else I took into consideration was the double top that formed around the M3 resistance line, which made me think price may reverse down and change direction. Price almost never makes a straight move in one direction for too long before there is a correction, so I waited for this to happen. Price made the drop, and then showed signs of stalling (previous resistance area), the Value Chart was at a peak, and the price candle turned green, as well as the 180 and 365 day EMA in an uptrend. All of those signals indicated I should place a Call, ITM.
My second trade I decided to place a Put, because price had failed to make a higher high, which backed my previous analysis, that price may reverse down after the double top. Where I messed up in this trade, was because I didn’t wait until the candle closed. This seems to be my biggest thing to overcome, I trade before the candle closes. While there was a few minutes left with this candle, it was heading down, as you can see by the large wicks, but right before the candle closed, it shot back up and closed OTM. If I waited for the candle to close, I could have prevented this.
My third trade was based on my second trade’s analysis. Price failed to make a higher high than the tests of the M3 resistance line, so to me traders were going to start selling. I waited until there was stronger selling movement, as well as the candle color turning red, and the value chart also signaling a Put. I don’t usually trade against the trend, but this case, price showed me that it was going to reverse, and on the higher TF’s it also showed a potential reversal at a key level (M3). This was my best trade today Pip-wise, finishing 4 pips ITM.