Introduction To Trends And Time Frames
Making sense of trends and time frames is an often confusing task. At any one time, in any given time frame, multiple trends can be at play. There are long term secular trends, shorter term primary trends, still shorter term secondary trends and yet shorter still near and short term trends. Adding to the confusion of trends is the time frame. What may be easy to spot in one time frame may not be so easy to spot in another. This article will help to make some sense out of trend and time frame for binary traders. This is an important aspect of trading and one that I highly recommend everyone master regardless of their chosen strategy. The old saying, “the trend is your friend, trade with your friend” is as true today as the day it was first spoken. Likewise, the saying “a rising tide lifts all boats” is equally apt.
A trend is defined as a general direction is which something is moving or developing. In the case of trading financial assets a trend is a measurable direction in prices, usually up or down. Trends can and do exist in every time frame and understanding how they work is one key to avoiding frustration. Imagine this, the tide is rolling in and each wave that comes onto the shore is a little higher than the next. All of a sudden one wave pulls way way back, looking as if the tide may have turned. Is it more likely that the next wave will meet or exceed the previous high water mark or less? This is the essence of trend analysis, determining the direction of the market tide and the probability that the next wave will be higher or lower than the next.
The Secular Trend
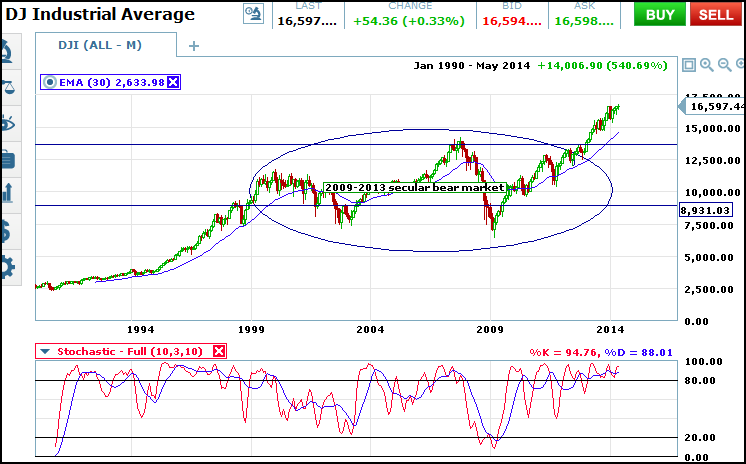
The first, and strongest, trend for traders to be aware of the secular trend. The secular trend is one that last anywhere from 7 to 15 years and is usually in synch with underlying economic conditions. A secular bear market is one in which the markets trend down to sideways for a period measured in years. A secular bull market is one in which the markets trend upward for years. In a bull secular market it is more likely for shorter term bear markets to meet support and return to bullishness than they are to result in major correction. The same is true in reverse for a secular bear market. This trend can be observed on a chart of 10 years duration or longer as shown here. I use monthly closing to help focus the chart. Within the secular bear market labeled here there are periods of up and periods of down markets, these are the primary trend.
The Primary Or Long Term Trend
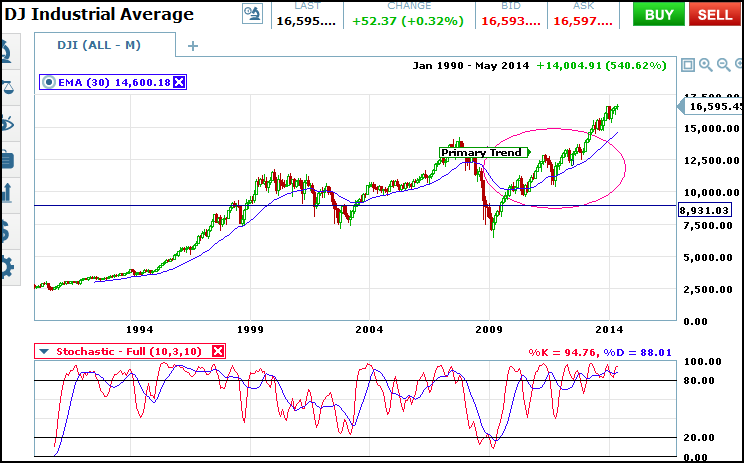
The primary trend is the largest measurable price movement within a secular market. These trends tend to last from 3 to five years depending on strength. You can see that within the secular market I have market there are at least five discernible primary trends ending with the final bull trend that broke the top of the secular bear market range. Take note that during the secular bear market that the bearish primary trends are much stronger and of longer duration than the bullish primaries. This same phenomenon will be true in reverse for secular bull markets. In order to analyze the primary trend I drill down to a 3-5 year chart of weekly closing prices, whichever is needed to include the entire movement. This next chart shows the final primary trend of the 1999-2013 secular bear market. We can see again that on this chart that there are shorter bull and bear markets within this trend but that the underlying primary is in control. Bear markets are not as deep as bull markets are tall. Trades made in this time frame would have an outlook of weeks or even months.
The Secondary Or Short Term Trend
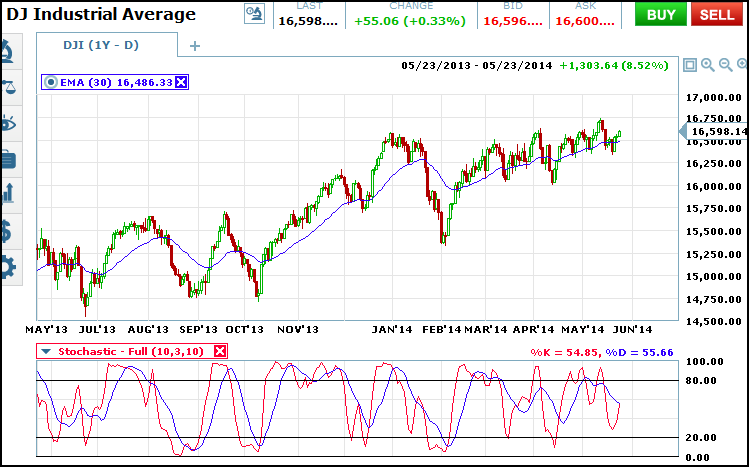
Within the primary trend are secondary trends. These are the near and short term rallies and dips driven by news and events. They are also the trends of most interest to me and other binary traders focusing on weekly and monthly expiries. To view the secondary trends I move down to charts of daily price action like the one below. Signals on this chart would have an outlook of a few days to a week or up to a month. There are even trends within this trend driven mostly be fears and expectations and less by actual news or events.
Why Is Trend Analysis Important?
It is important to understand trend for several reasons but most importantly to help understand why one trade is more likely to profit than another. If the market is trending lower in the primary trend then it is less likely for a bullish play on the secondary trend to work than a bearish one. Likewise, if a signal in the secondary trend confirms the primary trend then it has a higher chance of profiting than a secondary signal that is counter to the primary trend. One way to line up a great trade is to have as many time frames in confirmation as possible. The secular trend is really too long for binary traders but you can start with the primary trend and move down to the secondary trend and then the near term trend. A signal taken with all three trends in alignment has the most chance of success.