Improving the Odds When Trading Intra-Day Breakouts
The breakout is one of the most common binary options trading strategies, yet is often utilized ineffectively. You’re watching what you believe to be an important price level, you have your trade ready to go and then the breakout occurs. For a few minutes things look great and you’re in the money (ITM), only to be out of the money (OTM) moments later. The problem is that you may be entering breakout trades at the wrong time. Here are two ways to increase your odds of success and establish a more reliable entry point when trading intra-day breakouts.
On Range Breakouts, Wait for the Pullback
When the price of an asset–whether it is a currency pair or stock–is moving sideways, it begins to attract attention. Traders are watching for the high (resistance) or low (support) of the price band to break, so they can trade the breakout and hopefully make a quick profit. But ranges are notorious for creating false breakouts; the price edges just past the former high or low, triggers your order, but then slips right back into the range. Frustrating.
One way to avoid this is to let the price break out of the range, and not trade it. Instead, simply watch the price as it initially moves beyond the high or low of range. For example, if a range develops between 1.3095 and 1.3050 in the EUR/USD and the price move to 1.3030, this would be a downside breakout, but no trade is made.
Wait for a pullback. Only enter short/sell (or buy a put option) if the price moves back toward 1.3050 and then begins to drop again. Or, if the price rallies back into the old range, only short it when it drops back below the 1.3050.
Figure 1 shows the EUR/USD ranging between 1.3070 and 1.30537, as marked by the green horizontal lines, on March 5/6 heading into the London open. Just prior to the London session (highlighted in yellow) the pair breaks lower, but no trade is taken—instead we wait. The price then rallies back into the old range—the pullback—and then proceeds to drop back below the support level of the range (1.30537) and a short/sell/put trade is made. The pair continued to fall throughout the London and US (highlighted in blue) sessions; this may not always be the case.
Figure 1. EUR/USD – 5 Minute Chart
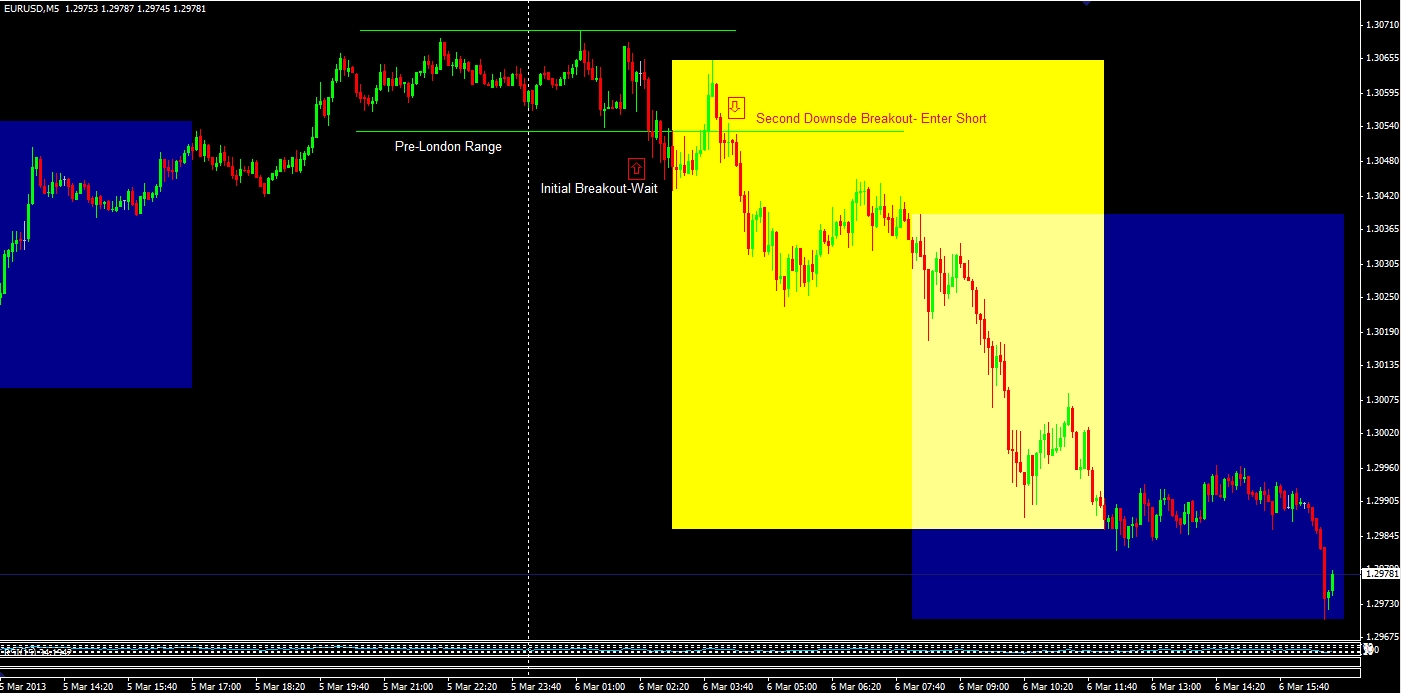
Source: Oanda-MetaTrader
Pros and Cons
The major advantage of using this technique is that you actually get to see if a breakout occurs, instead of guessing in real-time. If the breakout occurs, then you wait for a pullback, and then if the pair begins to move in the breakout direction again, you have yourself a trade. The downside is that you will likely have fewer trades, as not all breakouts pull back toward, or into, the old range. As with any strategy there is also no guarantee that your patience will result in a profit; you won’t win all the time. By being patient though, and picking your entries move carefully, you are more likely to be in the money for a longer period of time than if you simply trade every breakout as it occurs.
Look For Less Obvious Breakout Patterns
Ranges are easy to spot, and so they attract a lot of attention, usually resulting in numerous false breakouts before a legitimate one occurs. Other patterns, which are not as easy to spot, therefore offer profit potential largely untapped by the individual trader. With a little practice, the triangle is easy to spot, easy to trade and quite reliable. If you watch several currency pairs (or stocks or commodities) you will likely see examples of this patterns every day.
There are other chart patterns (to be addressed in future articles) but triangles are one of the most important as they are frequent, reliable (but you still won’t win every time) and get you away from only focusing on horizontal price lines, such as in ranges. A triangle occurs when the price is moving within a smaller area over time. When you draw lines around this price action, it is converging and therefore takes on a triangular shape. Figure 2 shows two examples of triangles; the first results in an upside breakout, the second triangle in a downside breakout. Trades are made in the direction of the breakout, which is when the price moves outside the triangle pattern. With these patterns waiting for a pullback is not required, as it is with ranges.
Figure 2. AUD/USD – 5 Minute Chart
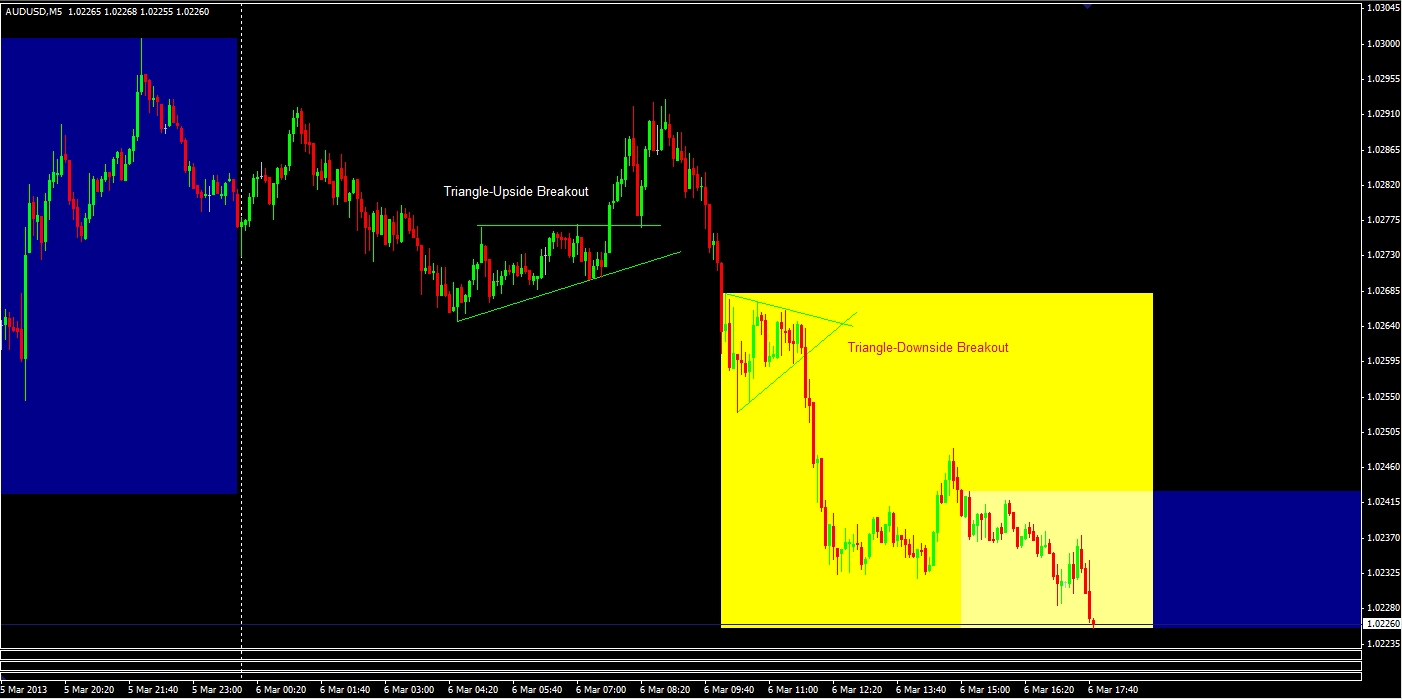
Source: Oanda –MetaTrader
Pros and Cons
Looking for breakouts from patterns other than ranges opens up a whole new world of trade possibilities. Trading triangles is a good place to start. When a breakout from a triangle occurs intra-day, or on a long-term chart as well, you can usually expect several bars of movement in the breakout direction. Occasionally the price will pullback to test the boundaries of the triangle, as it did on first triangle shown in figure 2. While I like trading triangles, not every signal will produce a profit. If the pair is moving in a very choppy fashion prior to the triangle developing, then the triangle becomes less reliable. To maximize your odds of trading triangles, look for strong price movement heading into the triangle, so that when the breakout occurs another strong move is likely.
Final Word
Ranges can be profitable, but numerous false breakouts can be frustrating to trade through. Instead, let a breakout occur and wait for a pullback. If after the pullback the pair then begins to move back in the breakout direction, take the trade. While the range breakout is a popular trade, train your eyes to spot breakouts from other chart patterns as well, such as the triangle. Triangles occur when the price action of a currency pair is converging, resulting in a triangular appearance. When the price moves outside the triangle you have a breakout, and a potential trade. Ideally, trade triangles only when the pair has a definitive directional move heading into the triangle, such as the examples shown in figure 2. Practice using these entry techniques, and establish a profitable exit strategy, before trading them with real money.