How to trade Divergences
Hi everyone,
In this article I will explain you what divergence is and how to trade it. For trading divergences we need only Price Action and one indicator. The indicator might be an oscillator like the RSI or the stochastic, might be a momentum indicator like CCI or the Momentum or finally you can trade Volume divergences with a volume indicator.
First of all, I want to say what divergence is. When the traders say “divergence” mean a disagreement between Price Action Signals and Indicators Signals. Let’s see our first screen shot. It’s from USDJPY currency pair.
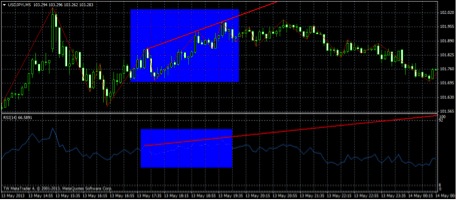
As you can see in this chart I use only a 14 period RSI. Look the price behavior in the blue box. It makes higher- highs. Now, look at the RSI behavior. It makes higher- highs, too. In this case the price action and the oscillator agree. There is not a divergence. Take a look in the second screen shot. It’s from AUDUSD currency pair.
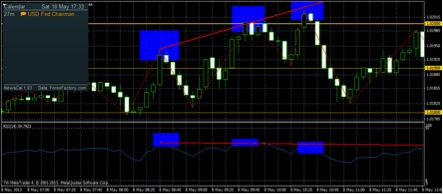
In this case, you can easily see that the price makes Higher- Highs but our 14 period RSI makes lower- highs. So, we have a disagreement here and there is a divergence. With the price making HHs and the oscillator making LHs we have a sell signal. In this case we have a mini up-trend and it’s time for a big reversal of the trend. Notice that after the disagreement we have a big movement down and the price finally stops moving down in the support near the whole number (the yellow horizontal line). If there is an opposite condition in which the price makes lower- highs and our indicator higher- highs there is again a sell signal.
Bullish Signals
I said above when we have bearish signals. Now, I am going to say when there are bullish signals. Take a look. It’s from EURUSD currency pair.
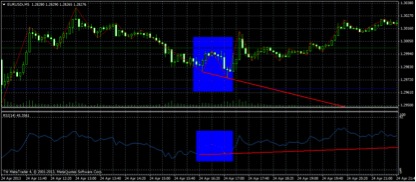
The price in the blue box makes lower- lows. Our indicator in the blue box makes higher- lows. There is a small disagreement here so there is also a small bullish divergence. Notice the bullish movement of the price after the reversal. In the opposite condition in which price makes higher- lows and our indicator makes lower- lows there is again a bullish signals.
You can use the indicator you want. In the charts I use the RSI. Divergence is a very strong tool and you should look for hidden divergences regardless of the strategy you are using.
Best Regards,
Kostasze