How to trade “Butterfly Patterns” with Binary Options
Botz here to help you spread your wings! No I am not doing a redbull commercial. I am talking Butterfly Patterns today and If you ever watched me trade live in the chatroom, you would often notice me drawing and saying funny names like “Butterflies/Bats/Crabs/Snakes/Gartleys/Sharks” All of which are pretty much the same thing, each having 5 points. I myself find they are not only useful in trading spot forex but also with Binary Options. These patterns are very common and you likely have noticed them from time to time. Yet maybe you have not trained yourself to take advantage of them. I will show you in the video below how I scale and measure these little trading animals, so you can tame the beasts and let them keep you in the green.

Now keep in mind these patterns will often be shaped differently and maybe form in different amounts of time. You might see them form in a few mins to a few hours to a few days. This is why “Self Similarity” and “Geometricity” are terms I want you to familiarize yourself with. All around us we have the Major and the Minor in all things from music to stars, to the toes on your feet. At least I hope you have toes. All self similar in scale from small to large.
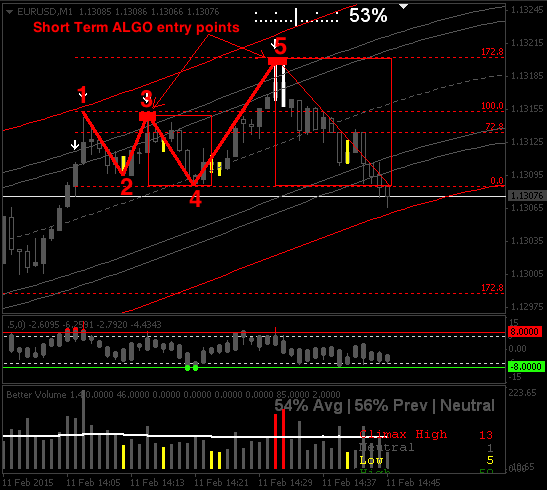
Again in this chart I will point out visually point 5 is 172.8% as the exact top which you will find statistically is most often between here and 200% of points 1 and 4. Also notice the two extreme volume bars at point 5 along with the extreme in the value charts indicator which would look the same if you use RSI CCI ect ect. One trick to note is the space between the bars in point 1 to 4 divided by 2 is around 8 bars. As it then leaves the smaller red box from 3 to 4 it then prints another 8 bars to the high @ point 5, giving it self similar geoaetricity in energy of the price/time square. If you don’t understand this, its ok your brain will in time. Just watch and count each time you notice a W or M formation on the charts. Also I will leave you with this image below to help you FOCUS on this pattern :)
Again remember they are just patterns that form probabilities based on confluences of variables to be used as an edge in your trading. Not as a certainty as those who use systems/patterns/indicators as non probabilistic de-facto linear outcomes will often blow their accounts trying to be de-facto. Only to really learn they were instead de-facto retarded. Markets are non-linear you look for the edge and trade it in your favor. Always trying to align yourself with the prevailing motion in the ocean. I hope you enjoyed this and you can learn to use these little animals in time for your bottom line!
Enjoy, LOB