How To Apply Volatility
How To Apply Volatility To Binary Options
Volatility is your friend, as I explained in a recent post. This is because volatility means movement, and movement means pips and pips means profits. Profits are why we are here, yes there are a wide variety of secondary reasons to be in the market but it always comes back to profits. Volatility is something that traders of more mainstream vehicles watch closely as it implies risk levels as well as pricing for things such as options and futures contracts. Traders of these assets can and will adjust their strategies from buy to sell and from long to short as the conditions warrant and these decisions are often based on the volatility. In fact, there are even indices, such as the VIX, that track volatility and can be traded. This is one way for a binary trader to use volatility to his or her advantage but not the only way. As a measure of market movement it can be used in a number of ways and there are a few different indicators based on volatility to choose from.
- Volatility is a measure of market movement that is unconcerned with direction. It measures the amount of movement on a day to day basis, relative to historic movements, and is often used as an indication of risk. Lower volatility assets move less and present less risk whereas higher volatility issues move more and have higher associated risk.
As a trader you can apply this theory in two ways. First you can search the market for likely trades and rank them based on a measure of volatility. If you are a less risky traders you may want to trade a less volatile asset, if you are a more risky trader you may choose to trade higher volatility assets. The second way, and the method I like best, is to stick with one asset and adjust your strategy as volatility warrants. I myself like to trade the S&P 500 so it is very easy for me to use the VIX as a measure of volatility. Some other, but not all, indices also have a volatility index such as the NASDAQ Composite and the VXN. Likewise, some, but not all, binary options brokers have options on the VIX and/or the VXN.
You can use volatility to track short term market cycles in order to adjust strategy and gain profitable entry points. Over time the every asset will go through periods of higher and lower volatility, and this could be in either direction, up, down or sideways. My caveat is that you must always take into account the underlying trend in the asset when applying volatility in this way. When volatility is low it is usually a time to buy, either a call or a put depending on circumstance. This is because the market has cooled off from previous movement and price action has calmed down. You will be able to get better positions, with better entry points and higher rates of profitability. Then, when the market moves, your options will move well into the money with less chance of loss, or breaking even which I think is worse.
Indicators For Measuring Volatility
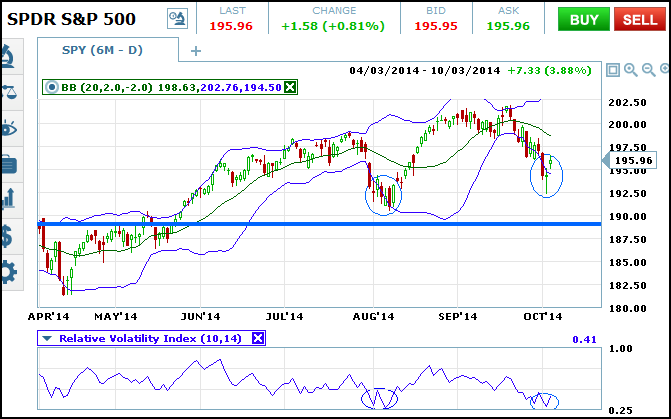
There are several prime indicators used by professional traders every day. These include a number of oscillators as well as Bollinger Bands ™. Bollinger Bands ™ are a proprietary method of trading that utilizes envelopes and channel theory along with volatility to find entry and exit points in commodity markets. The great news is that it works equally well on charts of any financial instrument. They are based on standard deviations of price movement relative to a central moving average. Signals are given when the bands move closer and further apart, when prices touch or exceed on of the bands and when prices touch or move past the central signal line.
Volatility can be harnesses profitably by binary options traders.
The Relative Volatility Indicator is an oscillator that tracks daily volatility relative to a set period, usually 10, and then smoothed by a 14 period moving average. This produces a indicator that ranges between 0 and 1 with 0.25 low and 0.75 high. If you look at the chart above you can see how the bottoming pattern that forms in the Relative Volatility Index happens when the SPY is touching or moving past the lower Bollinger Band. This is a double confirmation of a low in volatility and trend following entry that produced a move greater than 5% the first time….how much will it produce this time?