EUR/USD Trading at Markets World
One of my pre-trade rituals is to look for support and resistance levels starting way out on the daily time compression, followed by the four-hour, one-hour, 30-minute, 15-minute, and finally 5-minute chart. Today, I had a level marked off that I believed could very well be likely to come into play according to resistance that had formed from yesterday’s trading on the one-hour chart.

But as my trading day started, price first formed a support level at 1.33366. However, no call option would set up at that area (according to how I prefer to trade), as a strong bearish candle breached and closed below the level. Price formed a new support at 1.33354 in the process. This actually would turn out to be the daily low and actually provided a nice support level for a potential trade set-up just after 9AM EST (which I wasn’t around for).
My first trade came as a put option using the 1.33432 level as resistance. Price touched and strongly rejected the level on the 2:25 candle before finally re-touching on the 2:40 candle, after just missing a re-touch on the 2:35. This trade did spend a lot of time in favor, but it ended up losing by under one pip.
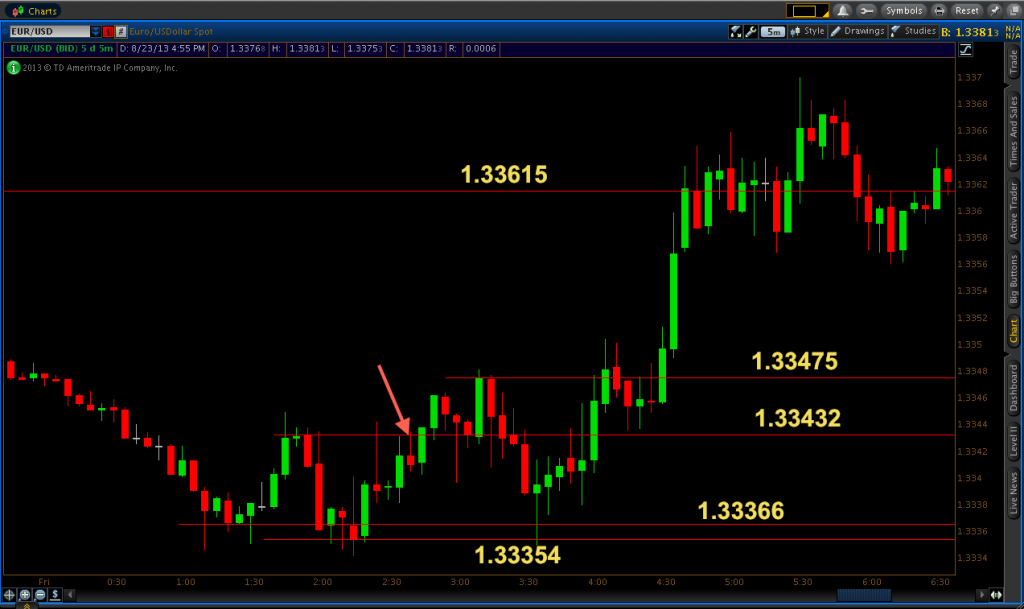
(And just to avoid any confusion about all the red lines in the above screenshot, the original source of the support/resistance can be found by following each line to the very left where it first formed. The top line is an exception, since it was drawn from the one-hour timeframe.)
Price did come back down to the 1.33354 level on the 3:35 candlestick, but I wasn’t able to get a re-touch on any subsequent candles, so that call option never materialized.
Right after, however, I began targeting put options back up at 1.33475. I did get a touch and reject of the level on the 4:00 candle, validating 1.33475 as a strong resistance level worth trading. As a result, once price re-hit 1.33475 on the 4:05 candle I took a put option and this trade closed about a pip in favor by expiration.

After 4:30AM EST, it became clear that price was on the upmove for the morning. I began targeting put option set-ups at the 1.33615 level. However, the market broke through that level on its first try on the 4:40 candle. Nevertheless, the general area of expected resistance did hold exceptionally well. A clear line of resistance began to hold about a couple pips above the original level I had drawn in on the hourly chart. After six consecutive candles successfully held the 1.33633 level, I took a put option at that price on the 5:05 candle and was able to get a one-pip winner by expiration.
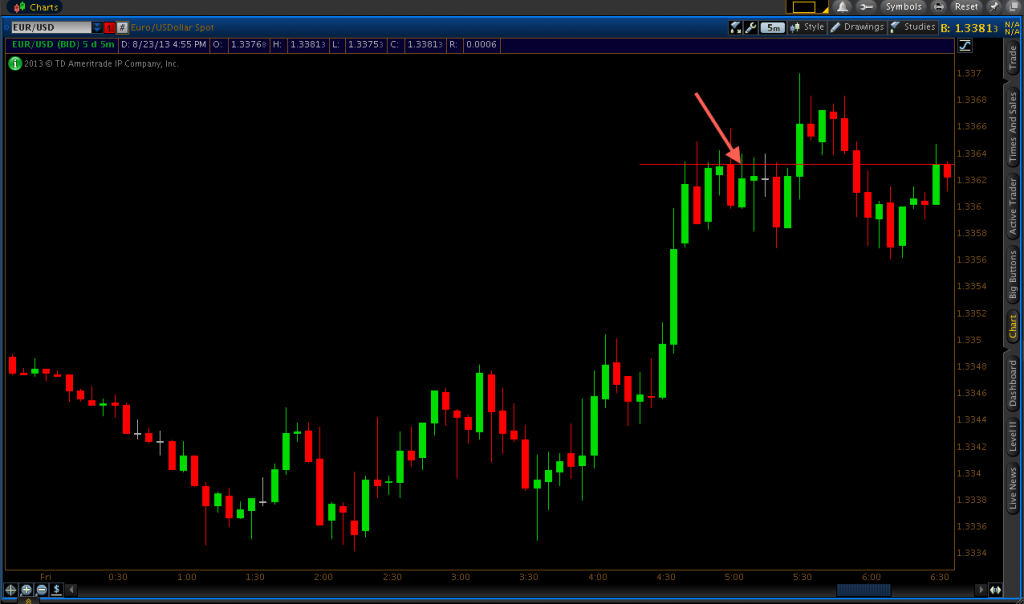
My strategy at this point was not to take subsequent trades at the same price although I had the opportunity like I did with my USD/CHF and gold trading this week. Instead I waited for price to break out of the strict trading range, as it was bound to occur soon as it’s rare for buy and sell orders to match up so well for long. I genuinely had no idea what the next move would be so I decided to wait.
It turned out that the market would break the resistance and make a new daily high with a resistance level I placed at 1.33672. But I never did end up taking a put option set-up here. After that, price retraced down and a new support level came into play at 1.33570. I did end up taking a call option at this level on the 6:50 candle after the initial rejection of the re-test on the 6:45.
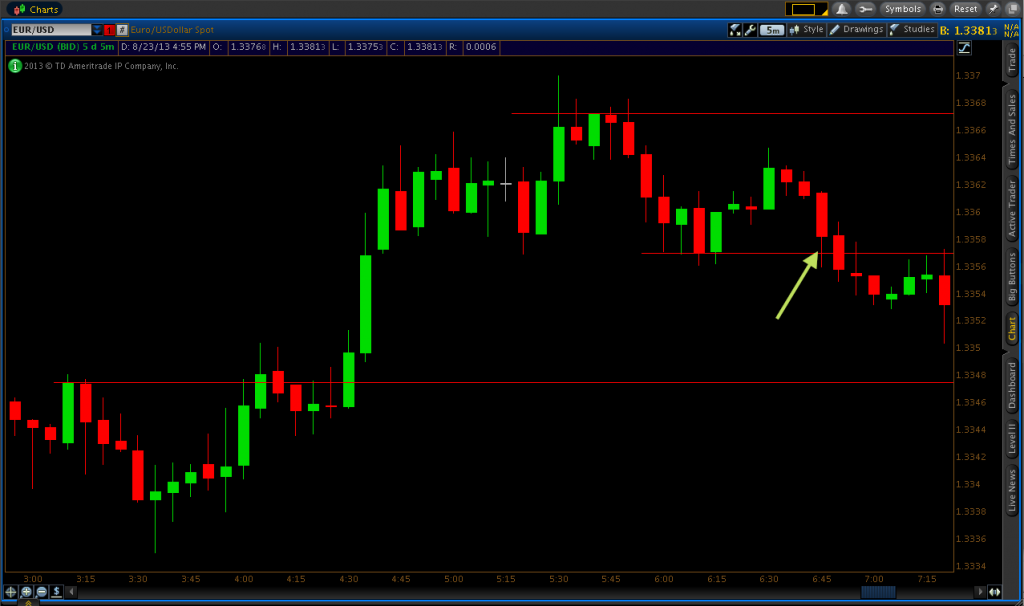
But in retrospect, I regret taking this trade. Not necessarily because it lost, but because of the weak retracement back up. Usually when I’m taking trades at a certain level, I at least like it to trade back into an area of the most previous support or resistance. I like to stick by this “rule,” because if price retraces weakly by only giving a mediocre thrust in the up direction (in this case), it suggests to me that the buyers are very weak players in the market and the sellers may be likely to win out back at the resistance level. It’s really just how things tend to work out based on my experiences examining the underlying market dynamics. Of course, I did take the trade as none of this was really passing through my brain at the time I took the trade. But I do occasionally make mistakes in my trading and hopefully I can learn from it going forward.
That was it for the day, and I went 2/4 ITM overall. I wasn’t profitable, but I felt I had been able to read the market fairly well.
Also, I must make a note that my pivot points weren’t working out today so I deleted them from my charts. For whatever reason, on all my charts, the indicator wasn’t working and produced an impossible set of pivot points that were bound very tightly together. I think the issue might stem from the latest update not reacting well to my existing pivot point code. Coding isn’t exactly my specialty and not something I actively work on, but I’ll have to see if I can do anything about it this weekend.