EURUSD Day Trades – December 18
Just a couple trades today during the early US session. There was a lot more opportunity but there is always another day. With it being an FOMC day, as the day progresses toward the announcement volatility usually tapers off and then explodes after the announcement. Therefore, I prefer to get in early on a couple good setups and then call it a day. Here are the trades from early in the US session today.
EURUSD Day Trades
The basic strategy used today was a fusion of the strategy first covered in Forex Day Trades – October 7 (with additional details in later day trading posts), as well as the “Simple as ABC” Trading Strategy.
Figure 1 shows the two long trades (technically 3 trades). Check marks indicate entry points, x’s indicate stop loss levels and the ‘thumbs up’ signal the profitable exit.
Figure 1. EURUSD 1 Minute Chart
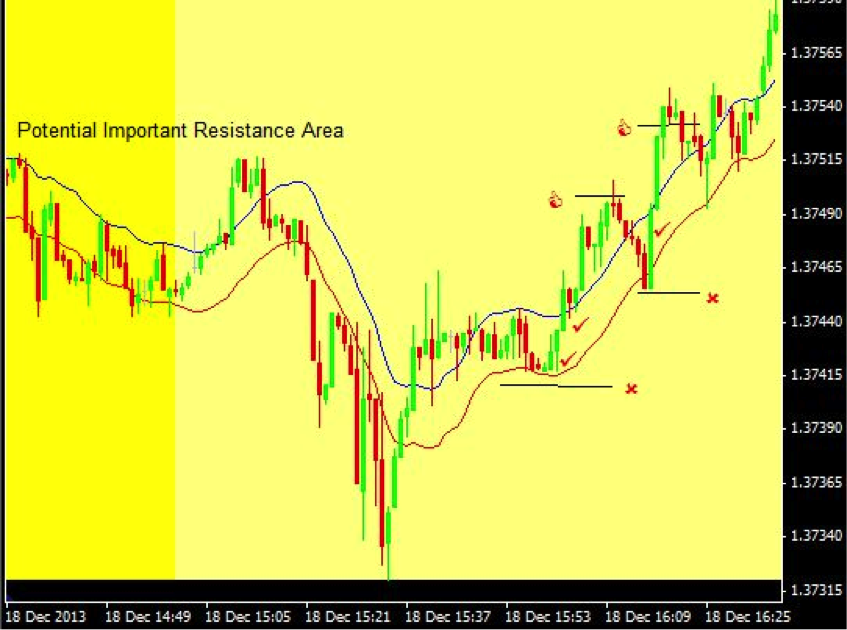
Following a fairly sharp decline, there is an aggressive rally, slightly larger in magnitude than the prior drop. This indicates a potential change in direction. After the move higher the price goes sideways, signaling there is little selling pressure.
The check marks indicate the entry points. For the first trade a long was taken near the low of the sideways consolidation (a little more than a pip of risk) and another long as the price was breaking higher out of the sideways channel (about 4 pips of risk).
The’ thumbs up’ sign marks the profitable exit. On the first trade I was looking for a little more than this, but the aggressive bars had ceased and the market looked like it would pause again. Took about 5 pips profit on the second entry and close to 8 on the first entry.
A pullback did follow, setting up another long trade. This time only one entry was taken as the price broke higher out of the small pullback channel. The result– 3 pips of risk and a profit of just over 5 pips.
Opted to quit after those trades as the price was moving into an area of former highs, which could potentially provide some resistance. The price did pause near those former highs, and then burst through, so if another long trade was taken it would have been profitable, but I always prefer to trade less and take just the high probability trades.
Considerations
I like trading these setups on a one minute chart, and based on the small movements I am capturing this is basically scalping. These patterns and setups occur on all timeframes though, so using a 5 or 15 minute chart (or even daily or weekly) you can still look for similar trade setups. If you pay more than a 1 pip spread on your forex trades, you’ll likely want to trade larger price swings, like what you’d see on a 5 or 15 minute chart. The idea behind the strategy is to isolate a strong impulse wave, wait for a pullback and then ride the next wave after the pullback completes.