Defining and Trading Around Important Support and Resistance
Support and resistance are words that get tossed around a lot, and traders and analysts will mark up their charts with all sorts of supposed support and resistance levels, but most of these levels really have minimal impact on the price. Understanding what an important support or resistance level is can help you isolate better trading opportunities and avoid likely losers.
Minor (or inaccurate) Support and Resistance
When most people mention support or resistance they are simply looking at a recent high or low on the chart. But do these highs and lows give any indication that those prices will provide support or resistance in the future?
In Figure 1, an indicator has been added to the chart which simply marks short-term high and low points with red (resistance) and blue (support) line.
Figure 1. EUR/USD 1 Minute Chart
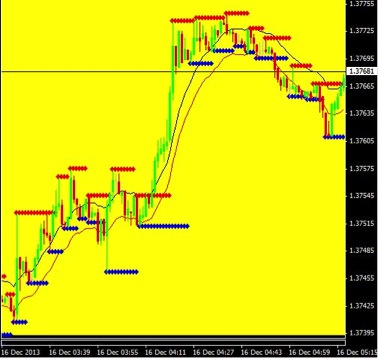
The first thing to realize is support and resistance levels, especially these minor ones based on short-term highs and lows, are likely to be broken relatively easily. During an uptrend we expect the recent highs to be broken as the price moves to a higher high (definition of uptrend). And during a downtrend we expect the price to move below recent lows (definition of downtrend).
Therefore, while these minor highs and lows may provide some trend confirmation, they do little to actually stop price from advancing or declining.
Important Support and Resistance
Certain levels are more likely to stop the price from rallying or falling though–these are called important support and resistance levels and are really the only support and resistance I pay attention to.
While we expect these levels to be broke at some point as well, they deserve more respect.
I show these levels respect by:
- not taking a short position when the price is right above important support
- not taking a long position when the price is right below important resistance
- possibly going long on a very strong bounce off support
- possibly going short on a very strong bounce off resistance
Those are a few of the trading guidelines (not absolute rules) I follow when trading around an important support or resistance level.
Important support and resistance levels are price regions which changed the direction of the market in a significant way.
In figure 2 regions that have causes reversals are marked on the chart with white boxes.
Figure 2. EURUSD 5 Minute Chart with Important Support and Resistance
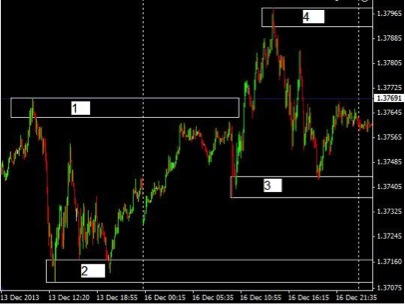
As soon as the price significantly reverses direction the area is marked with a rectangle, such as those in figure 2. They are then extended out to the right until broken (could be a very long or very short time). Learning to utilize this method will take time and practice.
Moving from left to right on the chart, the price is moving higher and then witnesses a significant drop. Since this area caused a significant reversal it is marked on the chart (1). While there is not guarantee this area will stop the price from rising in the future, it is quite possible the price will struggle to get through the area.
After the initial sharp drop the price bounces aggressively, drops again and then bounces aggressively. This indicates there is an important support level there (2). The price then proceeds to rally, and then stalls, just below the support level. It makes several attempts before finally breaking through.
Before breaking through 1 the price breaks lower and then rallies aggressively. While this level causes a smaller reversal than 1 and 2 it is marked because the direction did change (short-term lower low) and it does prove important toward the left on the chart as the price bounces off it.
4 marks where an aggressive rally died and reversed. In the future, when the price eventually approaches this area, it should be treated with respect.
If a level is drawn and then the price moves aggressively through it (“breaking ” it), it can be deleted as it is no longer relevant. Resistance marked “1” was broken by an aggressive move higher; once that occurs it can be deleted.
Final Word
These types of levels deserve respect, and thus I choose to alter my trading slightly when around them. Isolating a few important areas like this is much cleaner, and provides more relevant information, than drawing tons of unimportant high lows on the chart.
Where you draw the original area may not be the exact support or resistance area. For example, the area marked “1” encompassed the original high, but this level could be moved slightly lower (or drawn a bit bigger) to also contain where the price met resistance in that vicinity later on. Resistance and support are always areas which may need to be adjusted slightly over time.
How big you draw the areas will depend on volatility and the timeframe you are trading on. They should be small enough that they only focus on one particular region, but big enough that they will alert you of potential false breakouts or when the price is within proximity to the important area.
Play with this concept, potentially in conjunction with some of the trading guidelines, to come up with a personal plan for how you will define and handle these situations.