Will the Support keep the price up?
Hi everyone,
Many traders, especially the new traders, have problems to understand support and resistance levels and many times wonder why a support couldn’t keep the price up or a resistance couldn’t keep the price down. First of all, support and resistance levels are important levels and we can take some information from the price behaviour near them. But, nobody can say for sure if the support will keep the price up or the resistance will keep the price down. In this article I will give a very simple way to filter some entries near the support and resistance levels. How? With reversals with increasing volume. In my examples, I am going to use stocks because in stocks we know exactly how much is the trading volume every minute. In FX binary options assets we have an estimation for the volume but we will never have the accurate picture. So, let’s see some examples.
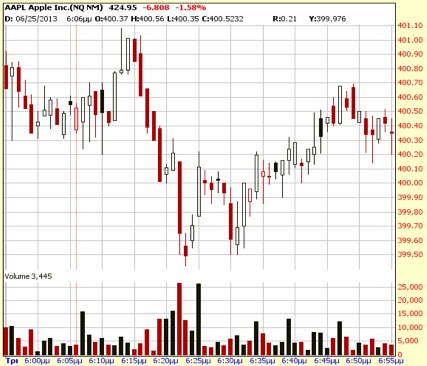
In the first chart we have APPLE stock. The first thing you have to do is to find a support or a resistance.When the price hit again this level you should look for two things. The first is the volume. Look at the middle of this screen shot. We have a support. After 7 minutes the price hit again this level. The next candle is bullish with more volume than the previous. For me, it’s a good time for a call. The second thing that could help you is the candlestick formation. Near these levels, I am looking for rejections (like this one as you can see in this chart), engulfing and pin bars.
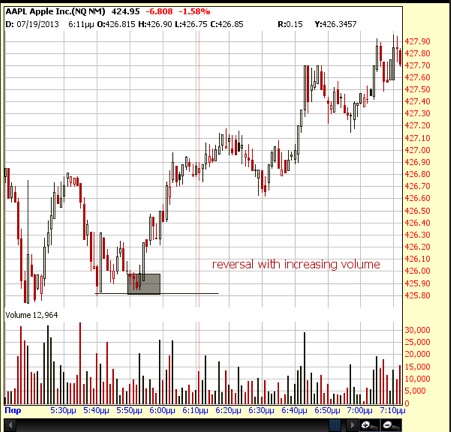
The second chart is gain from APPLE stock. I drew rectangle. 13 minutes ago the price made a support in this spot and now it hit it again. Look at the rectangle. We have a reversal and the reversal candle has more volume than the previous. We have also an engulfing pattern. Again, it’s a good time for a call for me. In cases like this, I usually take a binary option trade with 5 minutes expiry.
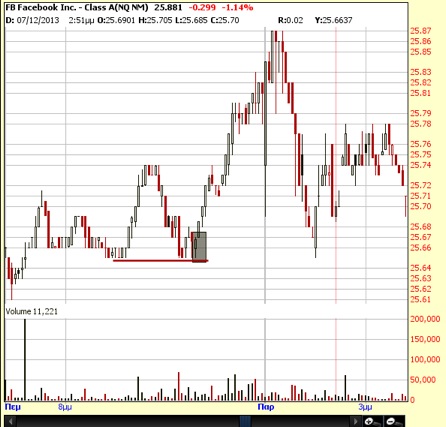
The last chart is from FACEBOOK stock. We have a previous support. The first time that the price hit it again we have a reversal bar. In this case the reversal bar has less volume than the previous and this means that the bulls are not so strong, yet. As you can see after two minutes the rice fell again to this spot. Now the reversal bar has clearly more volume than the previous. Now, it’s time to take the call. Notice the rejection.
I didn’t say that this way is a holly grail but it’s a good way for me to see when a support or a resistance is strong enough to keep the price in the opposite from its current direction.
Kind Regards,
Kostasze