Ways to use MACD
Good Day Traders,
In this article I will tell you some ways to use the MacD oscillator. It’s for sure one of the most popular indicators in the trading community and created by Gerald Appel in the late 1970s. You can see Macd in several forms out there because the traders and the coders try to adjust it to the their current strategy.
The default setting of this indicator are (12,26,9). Look at the first screen shot.
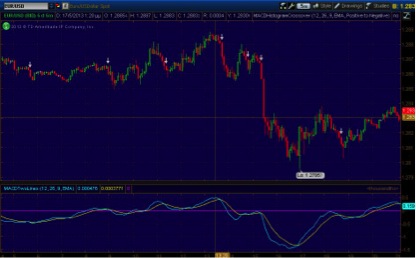
It’s from EURUSD currency pair. In this chart we have a MacD with default settings without the histogram. We have only the zero line(the purple line) and two EMAs, the 12 day which is the faster one and the 26 day which is the slower. Now, form this screen shot we could take some signals. When the EMAs are above the zero line there is a bullish activity. On the other hand, when the EMAs are below the zero line there is a bearish activity. In the chart you can see some put arrows. There arrows are EMAs crossovers. When the slower 26 EMA(the blue one) is above the 12 fast EMA we have short signal. In the opposite condition when the faster EMA is above the slower we have a long signal. The problem with this indicator is that it creates so many signals and as it’s natural many of them are wrong. Take a look in the second screen shot.
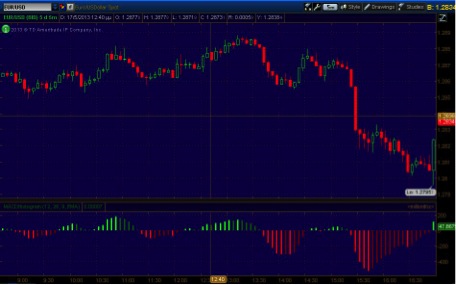
This is the same chart with the above EURUSD but here you can see a different view of MACD. We have a histogram. In the histogram notice the colors. We have light green and dark green. Red and dark red. When the histogram makes bars below the zero line it’s a bearish signal and when makes bars above the zero line it’s a bullish signal. Notice some spots in which there are bars above the zero line but we have down moves. These are with dark green color. It means that we have a down move but the momentum is still bullish and there is still bullish activity.
The best signals is when the MACD makes bars clearly above or below the zero line. You can use both the histogram and the EMAs to have a better picture what going on. Another way to use this indicator is the divergence as I said before in my article about divergences.
Many traders think that MACD is the holly grail. Of course it’s not.It repaints badly in most cases and as I said before it creates many signals. Some of them are good , some not. Filter the bad signals with price action and volume analysis. MACD is just a good confirmation.
Kind Regards,
Kostasze