Using and Interpreting Intra-day Pivot Points
Pivot Points are a popular tool used by day traders. Pivot Points use yesterday’s price action to provide potentially important price areas today. Therefore, traders run the calculation at night or in the morning to provide themselves with the Pivot Points for the upcoming session. That makes Pivot Points a “predictive” indicator, similar to Fibonacci Retracements or Fibonacci Extensions. There are a number of applications and chart platforms that calculate the Pivot Points for you, but we’ll go through the basic calculation as well.
Pivot Points
Pivot Points are a day trading tool, and therefore typically applied to chart time-frames of 15-minutes or less (1-min, 5-min, etc). The Pivot Point levels change from day to day, but don’t change during the day.
There are typically 5 lines using Standard Pivot Points (please note, over the years a number of Pivot Point variations have been developed). All calculations are based on the last trading session.
- Pivot Point (P) = (high + low + close) / 3
- Support 1 (S1) = (P x 2) – high
- Support 2 (S2) = P – (high – low)
- Resistance 1 (R1) = (P x 2) – Low
- Resistance 2 (R2) = P + (high – low)
Figure 1 shows how these are applied to a chart.
Figure 1. Pivot Points Applied to Apple (AAPL) – 5-Minute Chart
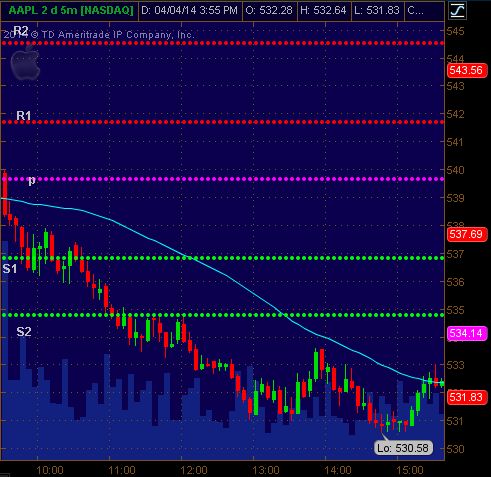
Source: Thinkorswim
As the example shows, sometimes several of the levels will not be relevant, as the price doesn’t even come close them. In this case, the price opens at the Pivot (P) and quickly drops, never moving toward R1 and R2.
Interpreting Pivot Points
The Pivot (P) provides a context for the day. When the price is above P it shows strength. When the price is below P it shows weakness. In figure 1 the price drops below P immediately after the open, showing initial weakness. This set a bearish tone and indicated that traders should be more inclined to take short positions (buying puts). The price won’t always stay on one side, but crossing above or below still indicates strength or weakness respectively.
If the price crosses below P, the first target is S1. If the price continues to decline the next target is S2.
If the price crosses above P, the first target is R1. If the price continues to advance the next is R2.
Additional Pivot Points can also be added, such as R3 or S3 to create even more levels to watch.
S1 and S2 can also act just like normal support. If the price reaches S1 or S2 and stops, traders can look for trade setups or patterns that indicate a bounce, and then take a long position as the price bounces off the support level. Typically traders wait for the price to pause and bounce, and not just assume that these levels will act as support.
In figure 1 the price shows no respect for S2, and just keeps dropping. When this occurs it indicates weakness, and therefore isn’t used as an opportunity to go long (buy calls).
The price does stall at S1, and possibly some traders may have viewed this as a bullish sign. But with overall momentum down, and no strong moves higher, even here traders should be more inclined to look for short positions (buy puts) than look for longs.
R1 and R2 act the same way. They provide areas of potential resistance. If the price reaches and stalls at a resistance area, traders can look for trade signals to go short (buy puts) once the price has shown respect for the resistance level. Don’t assume resistance will hold, rather wait for price to respect it and provide a trade signal.
Figure 2. R1 and R2 Acting as Resistance In GE – 5 minute chart
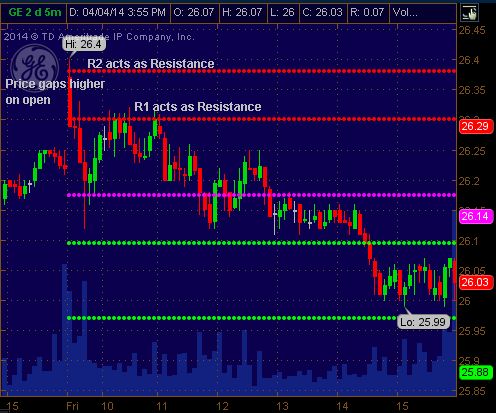
Source: Thinkorswim
Final Word
Pivot Points can be a useful tool for gauging intra-day momentum and providing some potentially important areas which traders can use to filter trade signals. Don’t assume to know what the price will do at a pivot point. You’ll need to watch price action so you can act quickly when signals materialize near these levels.