USD/CHF Trading on August 8, 2013: 4/5 ITM
I ended up finding and taking a trade right off the bat on the USD/CHF. The market had just formed an area of support at 0.92071 and was re-testing it again on the 2:25 (EST) candlestick. I took a call option at the re-touch of the level on the 2:30 candle and saw it progressively move in my favor. I thought I would start my morning out with a winning trade, but I turned out to be wrong. With just five minutes to go and up by nearly seven pips, I figured a winner would be had, especially considering that the hour is normally so tranquil in terms of market volume and movement. Nevertheless, the 2:40 (closing) candle fell hard through my entry point and I ended up with a two-pip loss.

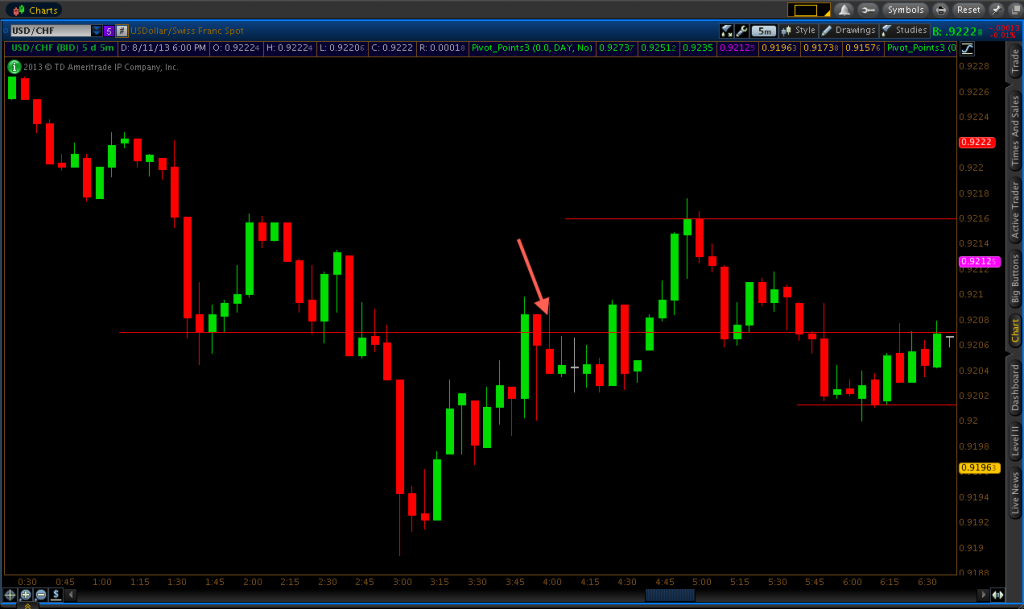
As a result of the last trade, I figured the pair might be entering a downtrend for the morning. So I began considering 0.92071 for put options, as pullback trades to support or resistance going with the overall trend are my favorite trade set-ups. Price did continue down and hit a bottom of .091922 before retracing back up to 0.92071. Price went right through the level on its first touch before heading back through with similar fortitude on the next candle.
Even though in many cases I never take set-ups that don’t work out the way I want them to – i.e., rejecting the touch of the level and closing below – this one was an exception. Even though this wasn’t an entry cleanly at the price I had marked off (0.92071), I still had confidence in expecting the market to go back down at least temporarily. The USD had been losing ground against the CHF all morning and the market had retraced back up to a sensitive level in the market. So on the 4:00 candlestick, when price reached up to the high of the previous candle – 0.92084 – I took a put option. The market fell back below the resistance level of 0.92071 as I expected and I had a four-pip winning trade.
Price eventually did breach 0.92071 to the up-side before 5AM EST and went up to 0.92160. This level had also served as a resistance point just after 2AM. Afterward, the market came back down and formed a higher bottom at 0.92013. Consequently, I had both levels – 0.92160 and 0.92013 – considered as put option and call option set-up areas, respectively. Given that no daily pivot points or Fibonacci retracement lines were in play today to help me find places in the market to trade, I had to rely on the price data alone to make my trading decisions.
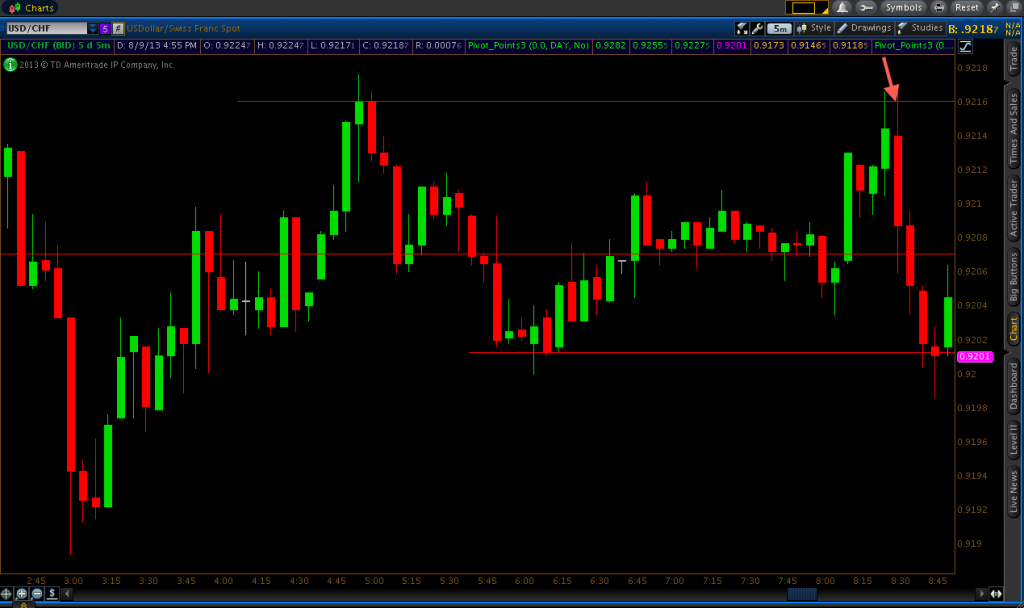
It actually took me over four hours before I was able to find my next set-up to trade. Price had meandered in that 15-pip channel during that time without re-testing either price level. The market did re-touch 0.92160 on the 8:25 candle. However, at 8:30 U.S. jobless claims data were to be released and it’s imperative that one always remains entirely mindful of any potential news announcements and remain out of short-term trades during those time periods. It’s essentially a 50-50 gamble, as technical cues often are not heeded during news time.
Nevertheless, when jobless claims were released, the number rose over the previous Thursday after a weaker than expected week for the U.S. labor market. As a result, since the number increased (and increasingly jobless-ness is bad), this was negative news for the U.S. economy and hence an expected drop in the USD was expected. Following that, I felt confident in keeping my plan to take a put option on the subsequent touch of 0.92160. The market was moving a bit quickly at this point so I actually got in the trade a couple pips lower than where I would have ideally wanted, but I still had a 13-pip winner by expiration. It turned out to be a very solid trade thanks to the increasing market volume in response to the jobless claims data. And again, I wasn’t trading the news here. I was simply trading my same technical strategy given fundamental factors were favorable toward my intended direction.
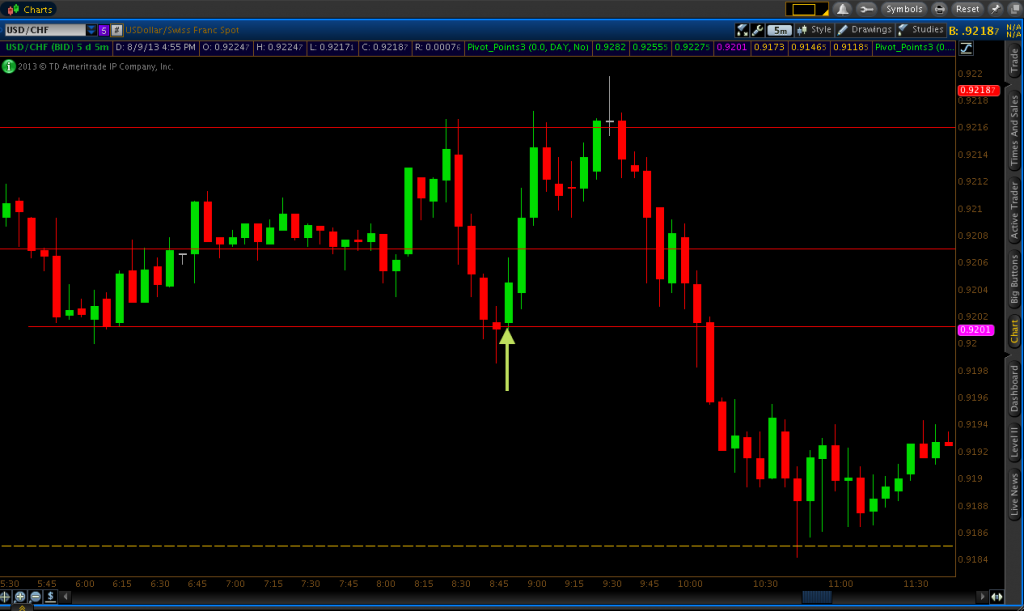
My next trade came back down at 0.92013. By this time, jobless claims data had been released twenty minutes ago. Usually, when important labor market news is released, the market breaks in one direction before recouping some of its losses or gains about 15-20 minutes after the announcement. In this case, the market was testing previous support, it was twenty minutes after the news release, and a “morning star” downtrend reversal pattern was forming to suggest a move back up. So on the 8:50 candle, at around 0.92013 near the candlestick’s open, I took a call option. This trade won by eight pips.
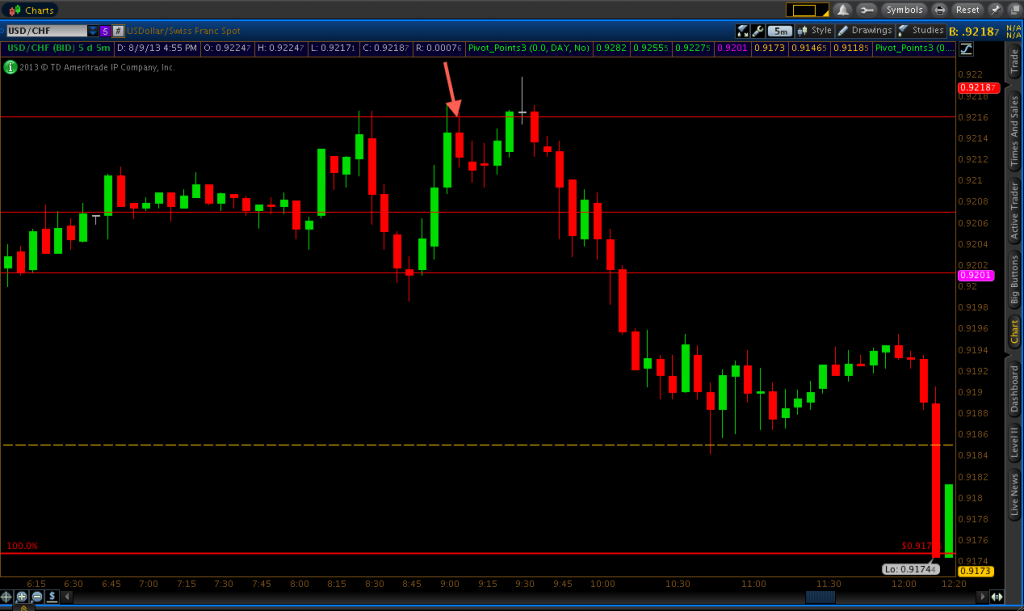
My final trade of the day came on the 9:05 candle. Price had come up and rejected 0.92160 once again on the 9:00 candlestick, validating its further use as a resistance level. So I took a put option at the touch of the 0.92160 on the following candle and had a nice, easy five-pip winner.
Please let me know if you have any questions or comments. I check the forum regularly so I will always do my best to return anything directed my way as quickly as possible. Also, if there is any trading-related topic in particular that anyone would like me to write about, I would definitely consider fulfilling any requests.