Two Ways to Increase the Probability on Early Morning Trades
When trading futures, stocks, ETFs or watching indexes–directly or via a binary option–the early morning trades often present the best opportunity. When the market opens orders flood in, creating volatility and profit potential. While I’ve read some trading books that say to avoid trading near the open and close of a market because it is too volatile, I could not disagree more. On the contrary, myself and almost every other professional trader I know makes nearly all their money near the open and close. Patterns are pronounced at the beginning of the day, because the moves are sharp, swift and often of large magnitude. This can kill traders who don’t know what they are doing, but with a couple ways to increase the probability of picking good entry points, hopefully you’ll start to like the market open as much as I do.
The Set-Up
Before you can increase your probability of find a good entry, you need a strategy. Here is a very simple one.
Before the market opens you’ll set up support and resistance zones. These are price areas at which the stock or future you’re watching is liking to reverse or “bounce” off of.
Given that we are trading the open, this is a day trade, and using a 1or 2 minute chart is recommended.
The first thing we look for is a gap in the price, from yesterday’s close to today’s open.
Figure 1 shows a gap in the S&P 500 Index, which is used for demonstration purposes.
Figure 1. S&P 500 Gap – 1 Minute Chart
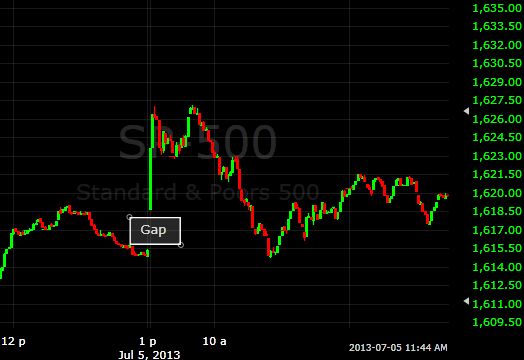
Once there is a gap we place a support or resistance zone, which will be near the previous day’s close. Since the market rallied higher off the open in Figure 1, the price area around the previous close is called the support zone. If the market had fallen away from the previous close, then the price area around the previous close would be a resistance zone.
Figure 2 shows the support zone created by the previous close. I generally use the last several minutes of the previous session as the support/resistance zone.
Figure 2. S&P 500 Support Zone – 2 Minute Chart
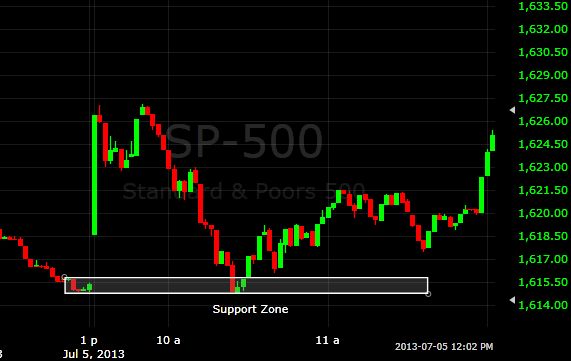
The goal is to go long/buy calls when the price is near the support the zone. Similarly, go short/buy puts when the price is near the resistance zone. In the case of Figure 2, we’d be buying calls…but when? That is where the probability enhancers come in.
Enhancer # 1: Make Sure the Price Leaves the Zone Before Making a Trade
Look back to Figure 2. In real-time the price could easily keep falling right through the support zone we’ve drawn. The support zone is a price area I usually expect the market to stall and reverse–near the previous close after a gap–but that doesn’t mean it always will.
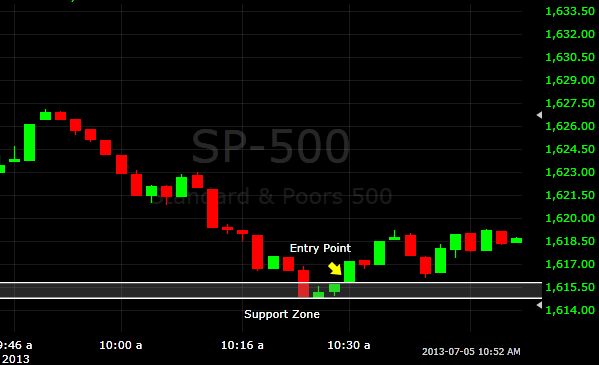
Therefore, wait for the price to enter the support/resistance zone, or just touch it, and then begin moving away from it before taking a trade. So In figure 2, you’d commence the long/call trade once the price is moving higher out of the support zone. This shows that at least temporarily the support zone is holding and the price is likely to rise. Figure 3 shows a zoomed in version of the prior charts. It shows the entry occurs as the price moves back out of the zone, as the zone looks like it will cause a reversal. If the price falls right through the zone, no trade is taken.
Figure 3 – Entry Point
In the case of a resistance zone, you’d enter short/buy puts once the price begins to fall back away from the resistance zone.
Enhancer # 2 – The Reversal Should Occur Quickly
In Figure 3 the price enters the support zone and within a couple bars it is already moving back out. While this support zone is relatively small–only about 1 point–some days the zone will be much bigger due to volatility near the close on the previous day (remember, the zone is created based on the last few bars at the previous close). Regardless of how big or small the zone is, the price shouldn’t stay in the zone for long. We want the price to bounce off the support or decline off the resistance zone within several minutes of getting close to it.
The sharper the reversal near the zone the better. Take Figure 3 for example. At a support zone you are expecting buying interest to enter the market, so if the price moves sharply higher near a support zone it shows that indeed there is buying interest there and going long/buying calls is the right choice. Similarly, at a resistance zone you expect selling/shorting, so when the price declines sharply off the zone it shows there is selling pressure and you want to be short/buying puts.
These Enhancers Can Be Used For Other Strategies
While these enhancers have been applied to a simple trading strategy for the purposes of this article, the enhancers are useful in many other strategies as well.
As for enhancer one, I almost always wait for the price to begin moving in the direction I want before making a trade. I never assume that support/resistance zones or levels will hold; only once the price respects the level or zone do I take my trade. Wait for price to confirm your technical analysis; don’t just assume the price will do what you want, when you want.
As for the second enhancer, if you have a strong support or resistance zone–based on whatever strategy or analysis method you’re using–and the price reverses aggressively off that zone, the odds are good the reversal will continue at least for the short-term.
Trade with the aggressive traders when they respect a support/resistance level.