Trading the Powerful Kicker Pattern
Probably the most powerful reversal signal in the candlestick charting universe, the Kicker pattern is one you need to know. It signals a massive shift in the sentiment of traders, often completely reversing the trend. And when they work out, you will be in the in-the-money quickly.
The Kicker Pattern
The kicker pattern is a major reversal signal, so we look for it after a sustained trend higher or lower. It is a very sharp reversal that occurs over two candles, although looking at several candles will provide a better context for whether it is a good kicker pattern or not.
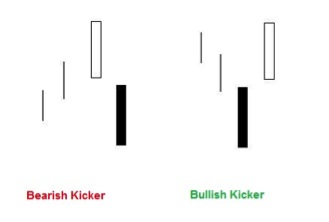
Here is what the patterns look like.
Figure 1. Bearish and Bullish Kicker
If you are unfamiliar with how to read candlestick charts, see Introduction to Japanese Candlestick Charts.
For the bearish pattern, the price is in an uptrend, with the first bar of the two bar pattern being an up bar (white: close is higher than open). The second bar of the pattern is a strong down bar (black: close is well below open). It opens at or below (gaps down) the open of the first candle. Basically the second bar should show a very strong shift in sentiment, where there is no hesitation on the part of sellers.
For the bullish pattern, the price is in a downtrend, with the first bar of the pattern being a down bar. The second bar of the pattern is a strong up bar. It opens at or above the open of the first candle. The second bar shows a very strong shift in sentiment, where is no hesitation on the part of buyers.
This pattern is typically seen on daily, weekly or monthly chart and more frequently in markets that close each night–such as the stock market. In the forex market this type of pattern would only occur if the second bar occurs after a weekend.
Trading
A trade is taken right near the close of the second bar, or alternatively at the open of the next bar. With such a strong shift we assume that the next bar following the pattern will also be strong, and in the same direction as the second candle.
Waiting for some sort of confirmation on this type of pattern is likely to do more harm than good since the price is likely to continue to run away from you.
Get in quickly and the price should quickly move you into the money. If the price doesn’t continue to the run in the same direction as the second candle, then get out (if trading traditional markets). A stop loss can be placed near the middle of the second candle, and moved to lock in profit as the price moves in your favor. Since this pattern can result in a full-fledged reversal there is no price target, so get out when momentum slows and look for other opportunities.
Figure 2 shows a bearish kicker pattern (circled).
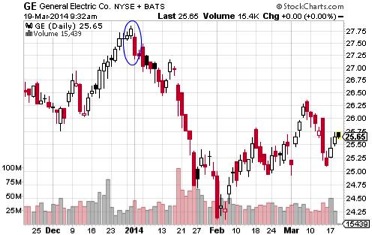
The trend is up, marked by the series of white bars. Then we have a strong down bar, that opens at or below the prior up bar. Most importantly, the down bar is very strong with the close of that bar finishing near the low–showing little hesitation on the part of sellers. Ideally the second candle should close even closer to the low. In figure 2 there was a brief pause and a bit of a retrace into the second bar before the selling resumed. This is why an initial stop is placed near the middle of the second candle, then quickly moved once the price moves in our favor.
Final Word
This is a good pattern, but no pattern is perfect. While it does often result in a reversal, finding the exact spot place to put a stop loss and a target can be tricky. The hope is the that the momentum from the second candle puts you in the money right away and then the trade can be managed more easily. If trading binary options, choose an expiry that allows enough time for the price to clear the second candle. The stronger second the candle the better, and the second candle gapping away from the first candle is another probability enhancer.