Trading Seasonality in Individual Stocks
Seasonality refers to recurring patterns in asset classes, often due to a time of the year impact. For example, summer may push up the price of crude of oil as more people drive cars and go on holidays, or heating oil prices may be pushed up in the winter as more people require heat in their homes.
Seasonality doesn’t always have to do with the seasons though, basically we can just think of it as a time of the year when prices seem to fall or rise with some regularity. We even see certain tendencies within the trading day. For more on that see Time of Day Tendencies for US Stock Market.
Individual stocks can also experience this phenomenon. At certain points in the year, certain stocks have been historically great buy and sell candidates. Why it occurs could just be random, or based on some underlying fundamental of the stock.
There are a number of programs out there– TradeMiner is one of them–that looks for these patterns in stocks.
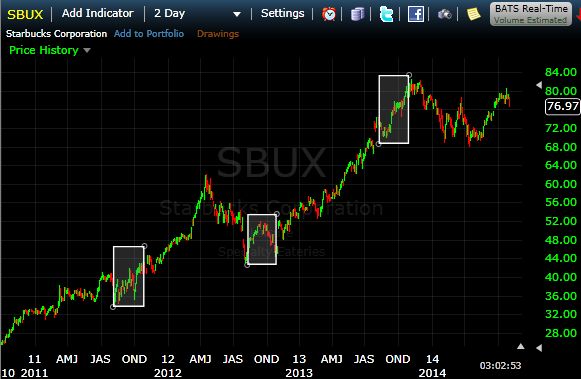
For example, for whatever reason, Starbucks (SBUX) seems to do well between August 6 and October 31. Over the last 12 years the stock has finished higher over this period 92% of the time, with an average profit of nearly 11% Figure 1 shows this period over the last few years. One thing to of course note is the overall uptrend in the stock over the last several years. If that trend reverses, it will likely have a negative impact on long trades taken during this period.
Crown Castle International (CCI) seems to well between August 13 and August 23, with an average gain of nearly 14%. 90% of the time, over the last 11 years the price has finished higher over this period.
Denbury Resources (DNR) on the other hand generally drops about 10%, 90+% of the time, between August 2 and August 28. This is based on data over the last 12 year.
There hundreds of patterns like this in different stocks and across different time frames.
Final Word
There is no guarantee these patterns will continue. While they have a high win percentage, TraderMiner is going back in time and looking for recurring patterns, and is bound to find a whole bunch.
Continue to do your own due diligence on your own trades and analyze the stocks you propose to trade. A major trend change could alter the results of these patterns drastically. Also, just because the win percentage on the pattern is high doesn’t mean the price went straight in that direction. A substantial loss may have been outstanding before the price eventually moved in the anticipated direction.
Also, not every year was a successful year for these patterns. In any given year these patterns could result in a losing trade. As is always said “Past results are not indicative of future performance.”