Trading Both Sides Of The Charts With Trading Ranges
What do I mean? Trading bear positions as well as trading bull positions. I know that I, and I suspect many newbies and advanced traders as well, started out learning to trade bull positions. It is easier and only natural as the tendency in trading and stock ownership is to buy low and then sell high. Another thing that may keep the average trader from entering a short or otherwise bullish position is margin and other account requirements associated with futures, forex and standardized options. The good news for binary options traders is that there is no limitation on your account and what you can trade so bearish strategies and techniques can be used with equal relish as bull ones, provided you make the right trades. That I think is the real reason why so many traders stick to bullish trading and/or have so much trouble trading bearish positions; they aren’t making the right trades.
When Not To Trade Bearish
There is one certain time when you should not make a bearish trade; when the market is bullish. This is a common mistake made by many new traders and I can say that because I have done it; trying to get bearish when the market is bullish. In general, even when we’re in a secular or long term bear market, the market is bullish. People want to buy stocks and when we are in a protracted bear market it is not so much because there are so many shorts in the market as it is that the buyers disappear. So, when the market is bullish it is not usually a good time to trade bearish but when is a good time? There are two key times in the market cycle when bearish positions are not only OK, but the preferred method of trading. The first is when the market is range bound and trending sideways, the second is when the market is in a well defined down trend. What makes up a well defined down trend may vary from trader to trader and depends greatly on time frame but once found is a fountain of profitable trades but that is for another time.
Trading A Range With Bear Positions
Ranges are great places to trade in a number of ways that include both bull and bear positions. The tops and bottoms of ranges are fantastic areas to look for reversal signals in the candlesticks and the indicators. In fact, ranges are perhaps the best place to use overbought and oversold readings on an oscillator. If the asset is up at, near or piercing the upper end of a range with overbought conditions on an indicator such as stochastic, RSI or MACD then chances are good a bearish strategy is the one you want. How do you know where the top of a range is? Usually it will be marked by a series of peaks or tops that stop at the same level with corresponding dips or bottoms that likewise stop at the same level. Look at the chart below. This a chart of daily price action for the EUR/USD US session. You can see that the pair has traded in a range from October 2013 until June 2014. This range is marked by Fibonacci Retracement levels and confirmed by price action about a dozen times, at least 6 at the top providing profitable entry each time.
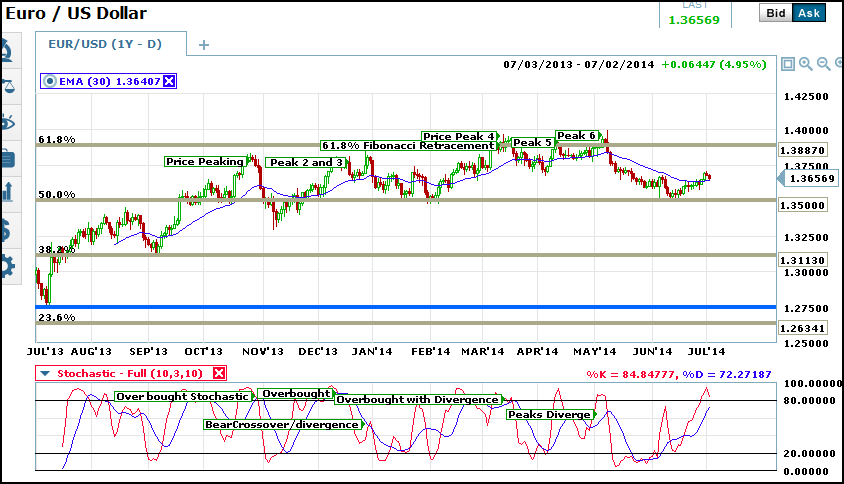
Once prices break above the 50% retracement line the first peak appears even before it reaches the next level. This peak is matched by a stochastic reading that enters overbought and produces a bearish crossover. The fact that the peak is appearing before reaching the next Fibonacci Level is one sign that prices will likely fall back to retest the 50% level and they do. The next signal is a bullish one but one that confirms a longer term range could be in play. The next peak, the next two peaks in fact, also occur once price approaches the upper range limit along with an overbought stochastic and bearish crossovers. Additionally, the first divergence is seen indicating an underlying weakness in the market. The next three peaks also come as price action reaches the upper limit of the range. They are also confirmed by overbought stochastic readings, bearish crossovers and a growing divergence that leads to a protracted visit to the low end of the range. The thing to take not of here is that this is a ranging market, even if you only get into trades based on this strategy on the 3rd or 4th peak you have made two great trades.
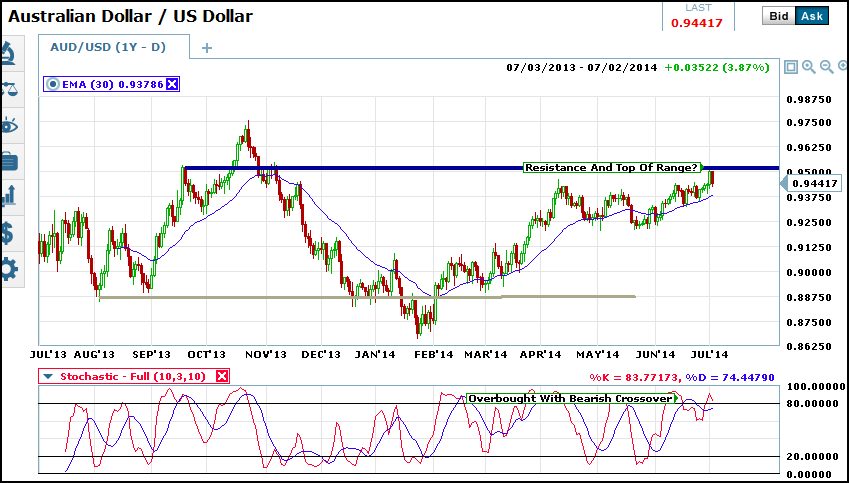
I used Fibonacci Retracements as the basis for my range. You can use other methods to mark a range such as simple support and resistance lines. You also do not have to limit your self to any one time frame although I prefer to use daily charts. Hourly and 30 minute are just as useful, especially for day trading. Take a look at the chart above of the AUD/USD. This is a chart of daily prices with support and resistance drawn at likely places. Resistance is being tested while candle action supports the possibility of a range top. Even without the range theory in place this is an attractive area for bearish strategy and is confirmed by, you guessed, an overbought stochastic with a bearish crossover.
Click here for more information on trading with Fibonacci Retracments and here to learn about using oscillators like stochastic and RSI.