Three Fibonacci Rules For Binary Options Traders
Fibonacci Retracements are a very useful tool and one that is part of my regular technical analysis. This tool is one based on thousands of years of mathematical observations originating in ancient Indian mathematics. Although he did not invent the number Fibonacci did a lot to bring it into widespread knowledge in middle aged Europe. The Fibonacci number, or sequence, is a derivative of the Golden Ratio and a phenomenon found throughout nature. The Golden Ratio has been used to describe the number and pattern of leaves on a tree, diamonds on the skin of a pineapple, the ratio of your arm span to your height and the movements of the markets. During the Renaissance the master artists used the ratio, and the Fibonacci Sequence, to lay out their greatest works. The ratios inherent in the Golden Ratio are inherent in nature.
Fibonacci Retracements are most often used by traders to predict areas of support but they can also be used to predict potential targets for resistance as well. For those of you who don’t know what Fibonacci Retracements are here is a quick primer; the Golden Ratio is used to divide rallies and bear markets into “retracement” levels. There are 6 levels; 23.6%, 38.2%, 50%,61.8%, 78.6% and 100%. Each rally or decline is measured from the tip of the high to the tip of the low (for a bear market) or from the tip of the low to the tip of the high (in a bull market). The Fibonacci tool uses that measurement to project the retracement levels onto the chart. Once projected the levels can be used as targets for pull backs, corrections, snap backs and reversals.
Using Fibonacci To Trade Binary Options
So, how do you apply Fibonacci for trading binary options. Simple; use them as potential areas for signals to form. A Fibonacci in and of itself is not really a signal, it is merely an estimation of where the market is likely to do something such as form a signal. What that something is will not be know until the market does it.
- Fibonacci Rule For Binary Options Traders – A Fibonacci Retracement Level is not a signal, it is a level where a signal is likely to occur.
Let’s look at the chart below. A major decline in gold stocks occurred at the same time as a decline in gold prices began. Barrick Gold was not immune to the sell off. There was a high in September 2012, this is where I will start my retracements. The stock’s most recent bottom is in early July so that is the point to which I measure for the retracements. The first thing that I notice is that the 23.6% retracement of the bear market emerged as a potential support/resistance line even before the decline hit bottom in July. Second, in the four months since the stock hit bottom it has tested that same resistance level four times and failed. That is four potential trades for savvy binary options traders using the daily charts and a sign of future bearishness.
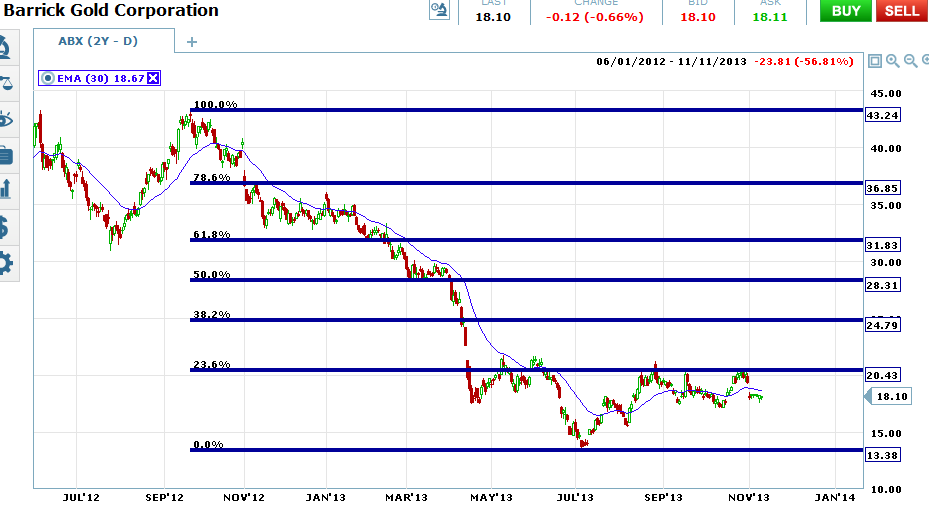
Now, looking at the same chart of daily prices, we can make some other analysis as well. Each level of the retracements can have different meaning. On this chart the 23.6% level is important because it can reinforce the underlying trend. If the trend is down and prices retreat to the 23.6% retracement and are repelled then the underlying down trend is likely to continue. On this chart, since prices are not able to break said level we can assume they won’t at this time and that prices will at least retest the most recent bottom.
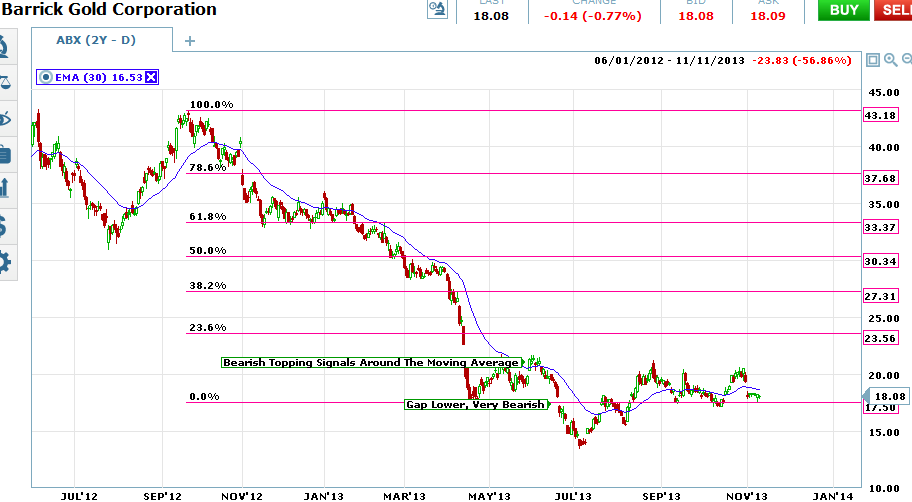
We can see this technique using the same chart with different retracement levels. If we redraw the Fibonacci retracements using the bottom that formed in late March it becomes somewhat obvious. Prices hit the bottom, bounced higher and were not even to make it as high as the 23.6% retracement before bearish topping signals emerged around the 30 day moving average. Prices then continue moving lower and then gap below the 0% line without even testing it.
- Fibonacci Rule For Binary Options Trading – A signal that occurs at a retracement is stronger than one that doesn’t. But that doesn’t mean that a strong signal won’t occur between two lines.
Now, referring back to the retracement levels themselves, let’s talk about the importance of each line a little more. I touched base on how a bounce from the 23.6% line was potentially trend continuing, a break through that line is sign of a stronger reversal. Once prices break through a Fibonnacci line the next target is the next Fibonacci retracement level. Each retracement level that gets broken makes it more likely the next will be tested. A break below the 50% line makes full retracement of the original rally or decline highly probable.
Fibonacci Retracements For Short Term Trading
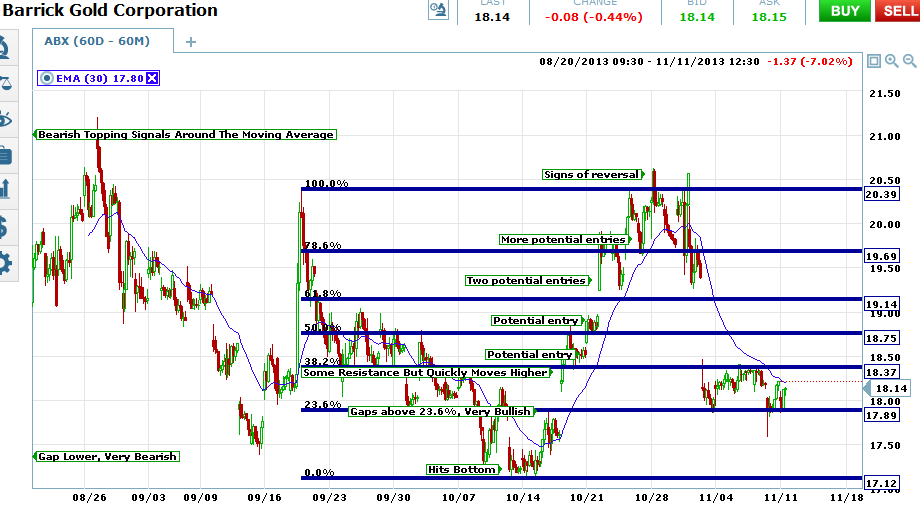
Looking at the chart below of 60 minute candlesticks I have applied a Fibonacci to a recent near term rally. The bounce from the bottom was very strong and provided several opportunities to trade short term binary options with expiries ranging from one hour to a few days or a week. Each time the asset price moved higher it moved above the retracement level with little to no resistance until hitting the top of the measured range. Notice how the asset provides an entry point at or just above each retracement level it is broken.
- Fibonacci Rule for binary options traders – Once a Fibonacci Retracement level has been broken the next retracement becomes the target. The stronger the move above the previous retracement the more likely the move will continue in the same direction.