Taking Advantage of the Pivot Point
I started watching the USD/CHF right after 1:30AM EST and price was hovering just below the pivot level of 0.94204 (purple line). Of course, with price under that level that would suggest that the pivot could provide an area for put options, with the expectation that price would come up, bounce off, and continue lower.
I was able to get into a put option on the 1:50 candle, which ended up as a small red doji, which is usually a potential candlestick reversal signal. As always, I didn’t just trade the first touch of the level. I waited for an initial touch of the pivot on the 1:45 candlestick, which closed right at 0.94204. I got into the put option right near the beginning of the 1:50 candle when price was simply staying put right at around the pivot point. The next candle, which also happened to be the expiration candle, actually turned out to be green, so this trade finished as a one-pip loser. However, you can see from the below screenshot that my belief that we would see some resistance at the pivot (hence my reason for taking the put option) eventually turned out to be true and price began to retrace back down. But quite a few trades do turn out that way – your general expectation about where the market is headed is correct yet you fall victim to a too-soon expiry. Of course, a lot of the time the opposite has held true and your trade finishes ITM just in time before it starts going against you. It works both ways.
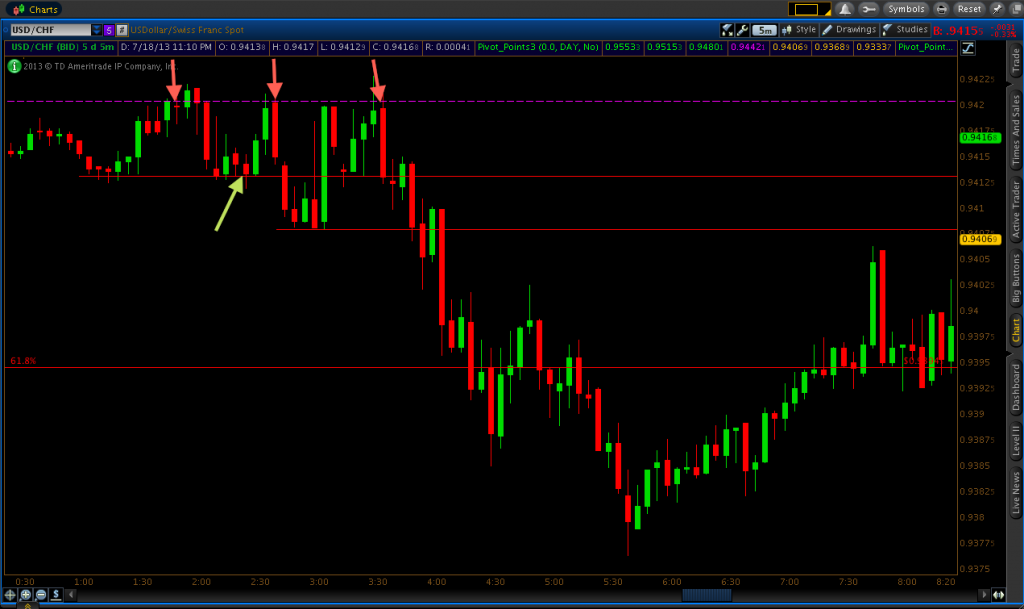
After that, I began considering 0.94131 as an area for call options based on the level of support that had formed there earlier. This was also before the European session even opened up, so price levels tend to be respected a bit more than in more volatile sessions (e.g., European/U.S. Crossover). The 0.94131 level was touched on the 2:10 candle, before getting a decent bullish 2:15 candle. Price rejected the level again on the 2:20 candle, so I got into the call option at the touch of the 2:25 candle when I was finally confident in the level holding.
In the meantime, I was actually able to get into another put option pivot level trade on the 2:40 candle after rejection on the 2:35. In essence I was basically playing bounces off support and resistance within the channel that had been formed between 0.94131 and 0.94204 (pivot level). My call option trade (taken at 0.94131) won by about two pips, while my put option trade (taken at the pivot) won by almost ten pips and broke the 0.94131 support in the process.
After these trades, price continued lower to 0.94079 before heading back up to the pivot level once again. Oftentimes, when the market is hitting a certain price level multiple times, it can be an indication that it could break through. But in this case, being the USD/CHF had actually just made a new low for the morning, it was signaling that an actual downtrend could construct itself instead. When price touched the pivot level on the 3:30 candle, it went about 2-3 pips above it before wicking back down below. I got in a put option on the 3:35 candle on the re-touch of 0.94204 and had an eight-pip winner by expiration.
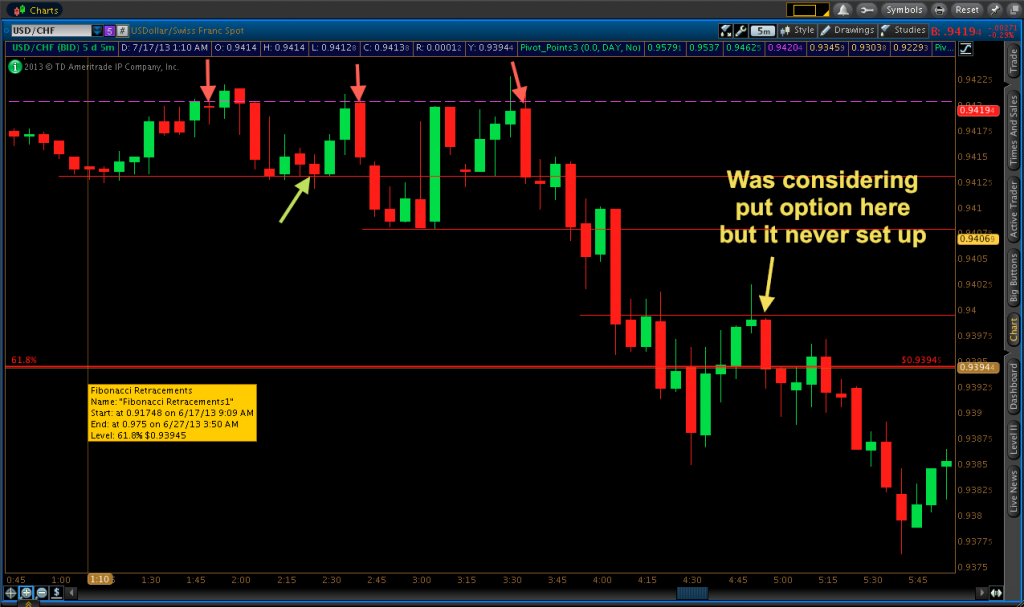
After the retrace back down from the pivot, it reached the low for the day at 0.94079 just before 4:00. However, I was not interested in taking a put option here for a couple of reasons:
a. the trend was giving evidence of a downward bias by making a new low for the morning;
b. when price re-touched 0.94079 on the 3:50 candle, downward momentum was relatively strong; and c. the 61.8% Fibonacci retracement (relevant to the price move 0.91748-0.97500) was sitting underneath that area. The market has a tendency to gravitate to notable Fibonacci areas as banks like to test the liquidity at those price levels. Therefore, I did not take a put option at 0.94079 and itstead waited for potential call option set-ups at the 61.8% Fibonacci level.
Although I watched the market until around 6AM EST, I never did find another good set-up that I wanted to take. Price was definitely showing some sensitivity to the Fibonacci line by meandering around the level. But a trade at the level, where I always like to take it, simply never set up. I had considered taking a put option at around the 0.9400 whole number at around 5AM. The trend was down and a potential area of resistance had been created at around that whole number (see the first red line above the 61.8% Fibonacci retracement in the image above). The market came back up to the whole number on the 4:50 candle and formed a green hammer candle – i.e., a strong reversal signal – but I wanted to get in the trade at 0.93995 or higher on the following candle (where the resistance level was), but price was already moving down so I never entered the trade. But I still wound up with a 3/4 ITM day.