Patience pays off: 2/2 ITM
The Euro was on a bit of an upstreak this morning. If you look at a daily chart of the EUR/USD, you’ll see that we are down at around the lows from mid-May. Being these could act as support level, I wasn’t surprised that the Euro made some gains against the USD today. That said, I don’t necessarily know if that level is going to hold and if we’ll see a bounce back up to the 1.3000 whole number. In fact, I’m betting against it in my forex trading currently. I took a short at my 50% Fibonacci retracement level of 1.28757 (drawn from the price movement 1.20411-1.37104), with my stop-loss placed at 1.29189 (above the daily high of the July 5 candle), with a take-profit at the 61.8% Fib level of 1.26788.
I’m not totally confident in this trade. Based on my stop-loss and take-profit level relative to my entry, it currently sits at over a 5:1 reward-to-risk, which is a pretty safe and conservative approach. Although we’re around recent support, I have the prevailing downtrend and Fibonacci level working in my favor. I’ve found that Fibonacci retracement lines tend to work very, very well in forex trading when plotted on the higher timeframes. I rely on them heavily to help me make decisions and they’re always nice when they pop-up in binary trading, as they help to give me a guide as to where price may potentially gravitate.
EUR/USD recent daily chart:

Also, I really like to stick with the trend when trading forex, prefering to take trades on pullbacks to support or resistance within the context of the current market trend. Incidentally, these are also my favorite types of trades with binary options, as well. Last week, I took a short trade from 1.30727 (38.2% Fibonacci) and got out of it at 1.28757 (50% Fib). All I was doing there is taking a short trade off a pullback back to the resistance point offered by the 50% Fib, and it netted nearly 200 pips worth of profit.
I guess the moral of the story is that it should always be a daily part of your pre-trading regimen as a binary trader to check the macroscopic picture of the asset(s) you’re trading. Check the daily chart, and you can continually narrow in your focus by looking at the four-hour, one-hour, 30-minute, 15-minute, and finally the 5-minute or 1-minute chart (whichever you prefer to trade with). Note any possible support or resistance on each timeframe – mark them on your chart with horizontal lines if you need to – and note the general market direction that the asset may be trending in.
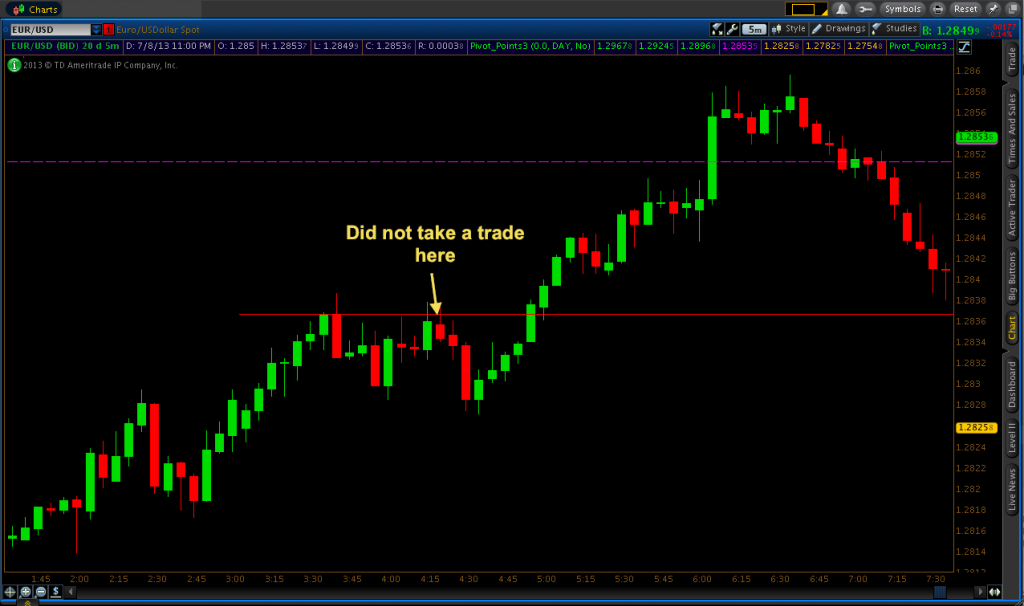
For today’s binary trades, it actually took me quite a long time to find a good set-up to trade. I started watching the markets around 3AM EST and it took me nearly five hours (!) to find a set-up I was comfortable trading. I did have a decent put option set-up on the 4:20 candle right around the 1.2837 price level (see image below), but I did not take it. I had a resistance level working in my favor, but I was wary of the trade because the prevailing trend for the morning was markedly to the north-side. The trade would have worked, but my belief that the EUR/USD would continue to go up was correct when it broke above 1.2837 at 5:00. Also, last Friday I had attempted to take a trade against the trend using just a weak support level. It was one of the two trades I lost that day, which served as a reminder to myself of the danger of trying to catch a falling knife, so to speak. Trading with the trend (if one applies) is always the best primary filter to apply toward your trading.
There was also a pivot level in play to act as a potential resistance area at 1.28513. Price did move up to that level at around 6:00. But of course it’s not a good idea to simply trade the level just to trade the level, especially against such a strong uptrend. I always prefer to have more than one factor going for me whenever I make a trade. The very best set-ups will have three or four things working in your favor (e.g., support or resistance level created from previous price history, the trend working in the intended direction of your trade, and even a pivot point or Fibonacci retracement level serving as support/resistance as well).
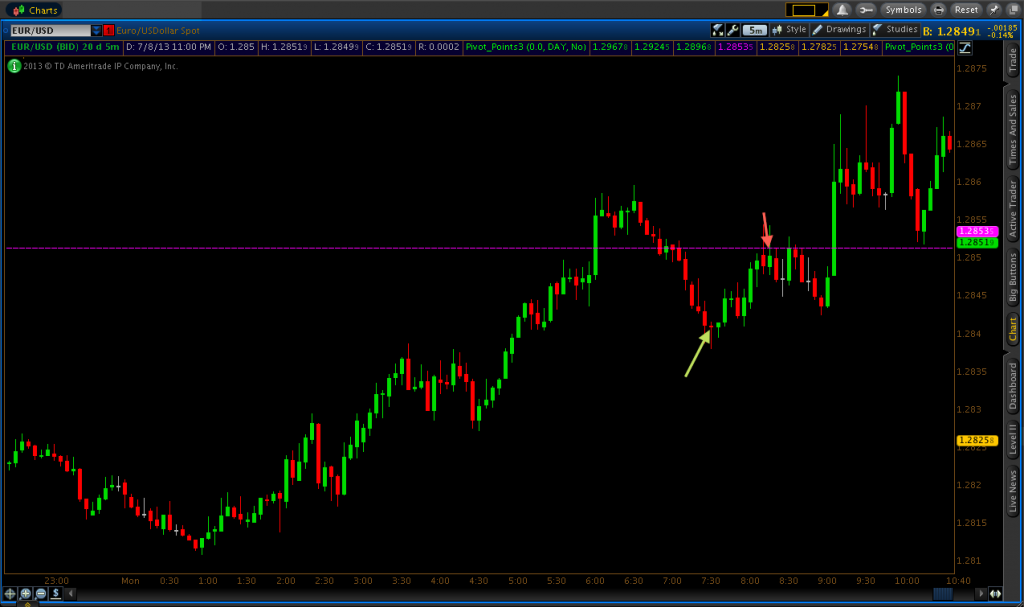
I did consider call options at the pivot level, but price never did touch and reject that level first – a form of price action confirmation that I prefer – so I never took the trade. It’s not one that would have worked out anyway as the market fell back below pivot. However, price had shown a bit of consolidation between 5:00-6:00 around 1.28407. Once the market got back down to that level at around 7:30, it touched, fell below, and wicked back above 1.28407. So on the following candle I took my first trade of the day, a call option on the touch of that price. This trade did spend some time in the red, but I had the trend working in my favor and the trade pushed itself above my entry point for about a one-pip winner.

My second trade occurred back up at the pivot level of 1.28513. The market had briefly consolidated there for about fifteen minutes just after 7:00, meaning price had shown some sensitivity to the level. Price touched and rejected the pivot on the 8:15 candle, so I took a put option on the subsequent touch on the 8:20 candle. I wasn’t as concerned about the direction of the trend on this trade – at least not enough for me to avoid the trade outright – as the market had essentially been neutral over the course of the past three hours and was no longer making new highs for the morning. This trade closed out over four pips in favor.
Overall, it took a long time for me to find these trades. But in trading, patience definitely pays off and it’s nice to start the week out strong.