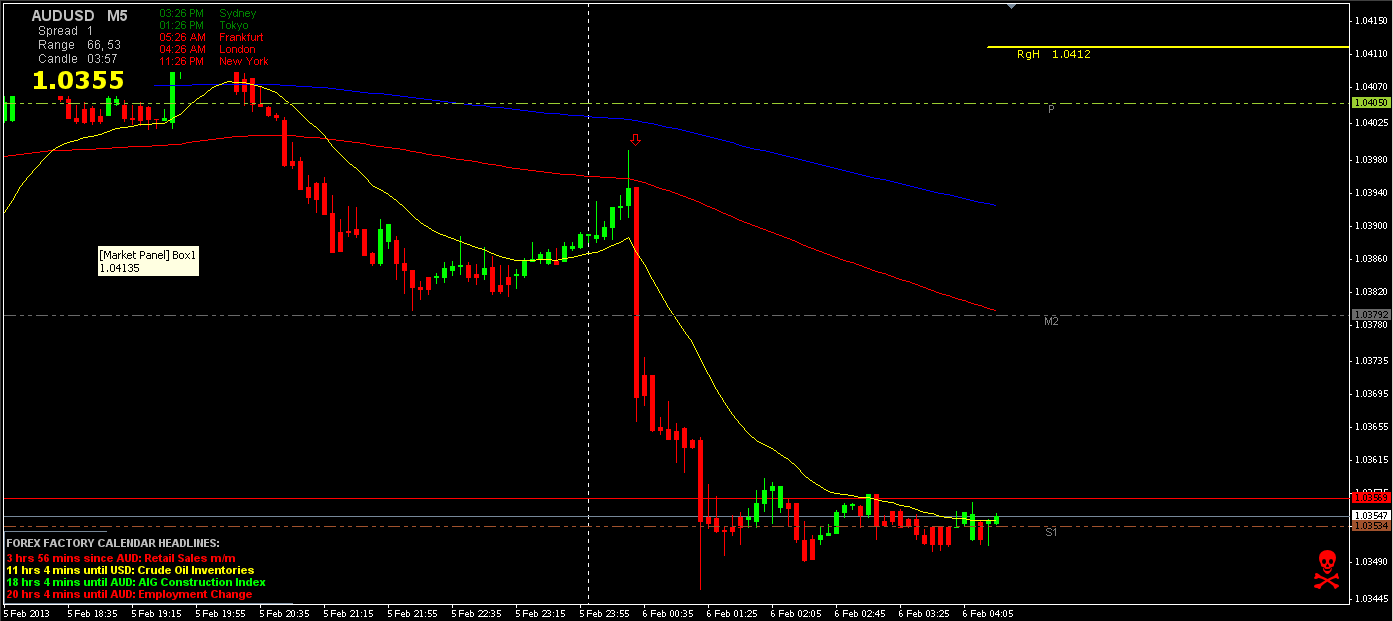
Only trade when price reaches the extremes of the range
Hello everyone, this evening was quite interesting trading the AUD/USD pair. If you didn’t see what happened just pull up your charts and look at the HUGE bearish bar right after the AUD retail sales report was released. Needless to say I stayed away from AUD/USD for the rest of the night, because of the high risk of such trades. It’s hard to analyze what price is doing when such a sharp move appears. I just stay away until things settle down, and I usually wait for the next day to look at the pair again.
Today I only traded twice, and I only paid attention to GBP/USD. At around 9 or so AM, price was at a peak of the day at 1.58034 and shortly after made a sharp move down, all the way to 1.56295 before price stalled and had a small correction. After price came back up slightly, it began to range for a while, and currently as I’m writing this it’s still ranging. After price hit the high and lows of the range a few times I placed my support and resistance lines on the chart. My rules for trading in a range is only to trade when price reaches the extremes of the range. When price went down and hit the support line, it didn’t close below it, which again validated to me that it was a strong support level. Shortly after it tested the level, it began to range for a bit (on the 1 minute chart), so I waited for a few candles to close, they also failed to close below the support line. By then I was looking to place a call, but first I had to have more than one indication that price was going to rise, in addition to the support level, price was a good distance from the 20EMA for a good “rubber band” trade. I waited for the next candle to turn green and move above the two previous bars high as well. Once price moved above the two previous candle highs (breakout on 1 min chart) I placed a call and rode the momentum up. This particular high probable trade was ITM by about 2 pips. My first trade I just followed the same rules as stated above, except for a put, it was ITM by about 1 pip.
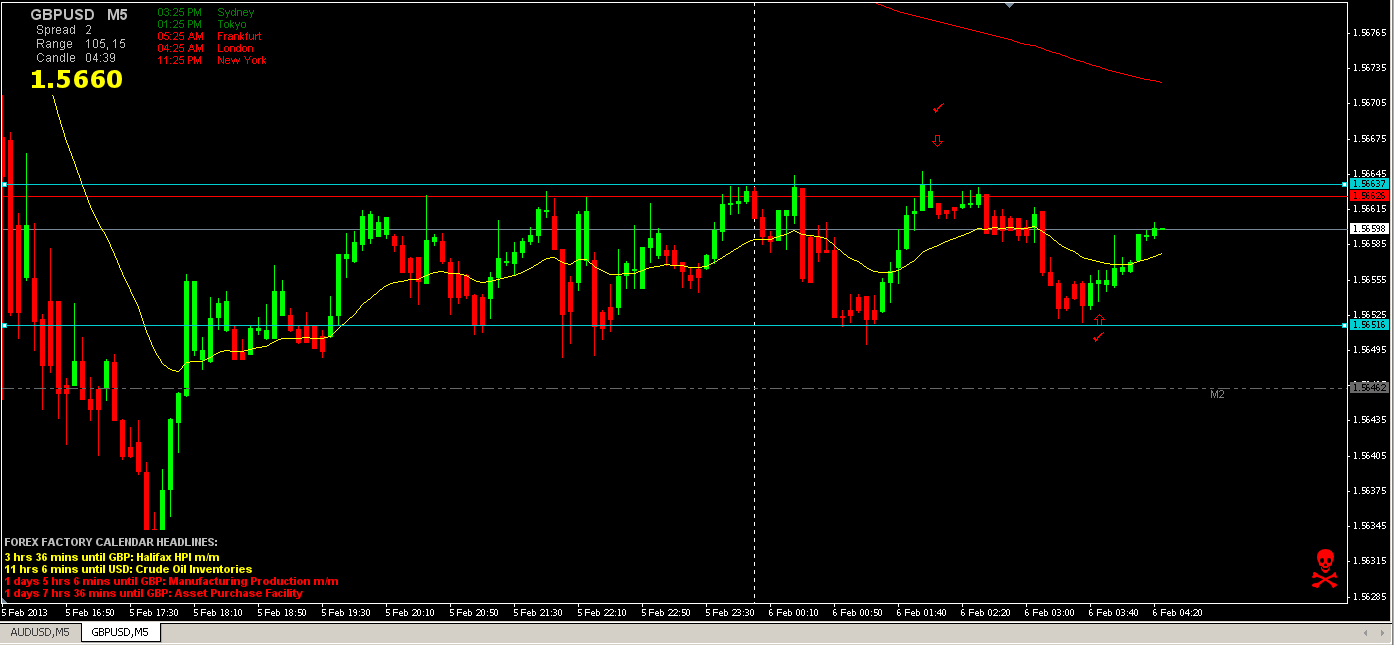
Since price has been ranging for quite some time now, I would look for price to break out of this range soon, because price doesn’t range forever. Now which way it breaks out is anyone’s guess, but I believe it will break out to the upside, for a correction from the previous 173 pip drop, but the key to profiting from this breakout is to be ready whenever it happens, mainly because when it does, it happens fast, and you have to get in quick or you will miss the move. You also must be careful because of false breakouts but once you get a trained eye, you can figure out what’s happening and trade accordingly. I’ll tell you breakouts still get me from time to time, but I’m getting better at trading them.