My Binary Options Trades This Week
Binary Options Trading for January 16, 2014
As I’ve mentioned to some extent in recent posts, one of the best things you can do to help your trading is to focus on a specific asset. Choose a specific asset, a particular charting timeframe, a time during the day to trade it, and a certain trade duration expiry to trade it in. It truly helps to get to learn an asset’s behavior by having the same daily routine. For me, the bulk of my binary options trading comes from looking at the USD/CHF on the five-minute chart, usually sometime between the hours of 2AM-8AM EST, and trading fifteen-minute expiries. I feel like I really know the USD/CHF by this point and I believe this strong familiarity with this asset has helped me obtain an ITM percentage that I’ve never been able to consistently attain before.
When I began looking at the USD/CHF on Thursday, January 16 just before 4AM EST, price had just made a recent high for the day and was beginning to decline down to the pivot point of 0.90717. Of course, I always pay attention to pivot points while trading. Pivot points are levels in the market that traders will usually place a lot of buy and sell orders at. Whenever there’s a place like that in the market, price may start acting a bit sensitive to it, almost like there’s a battle occurring there and may often serve as reversal points.
But I never trade a level just to trade it. That’s always a bad idea. Instead, I wait for confirmation that a level could hold and serve as a reversal point by waiting for a touch and rejection first. In the case of the daily pivot point, price simply blew right through it, which was not surprising given all the downward momentum that had been occurring.
However, the pivot would have been a strong place to consider put options going forward, especially considering put options would agree with the general direction of the trend for the morning. Yet when price re-visited the pivot on the 5:00 candle, there was no indication that pivot would hold considering upward momentum was strong this time around.

When price broke back above the pivot (0.90717) for certain on the 5:25 candle, it entered a 6-7 pip consolidation range. When the market retouched the pivot on the 6:05 candle, it was rejected and followed up by a retouch on the 6:10 candle. I did not immediately take the trade on the retouch, as I wasn’t exactly sure how well 0.90717 would hold as it hadn’t earlier. But after watching the price behavior around the pivot for nearly ten minutes, it suggested that the level would likely hold in this case, as 0.90717 was basically acting as a nice shelf of support. I thought I had at least a 60% chance of winning this trade so I decided to get into the trade at the beginning of the 6:15 candle. This eventually turned into a six-pip winner.

Price continued to bounce around in this consolidation area for over an hour-and-a-half. The very top of the channel was difficult to define in terms of a precise resistance level, though, which made taking a put option trade difficult to set-up in the first place. However, toward 7:30 it became clearer that resistance could be approximately defined around 0.90777. After consecutive rejections off this line of resistance, I decided to take a put option on the touch of 0.90777 on the 7:35 candle. This was a shorter trade and I won by just under two pips.

That was it for the day. News time would be coming up shortly anyway, as U.S. jobless claims were to be released in just under an hour at 8:30AM EST. That always throws some extra volume into the market, so it’s best not to be in any kind of short-term binary trade. Always looking at an economic calendar before you start your trading day is a good ritual to have in order to know what news announcements and data releases can affect the pair your trading. I would always suggest to ensure that one avoids being in trades during these time periods.
Binary Options Trading for January 14, 2014
It felt good to finally get back into actually taking trades on Tuesday, as it had been a week since I last did so. I didn’t trade on Monday, took no trade set-ups despite extensively watching the charts the previous Thursday and Friday, and didn’t trade that previous Wednesday. So it had beena a full seven days since my last trade.
Due to some rare late-night activity on the USD/CHF, this market was already up and above its resistance 2 level of 0.90584. Once it dipped back below resistance 2 by about four pips, it began encountering resistance at that level on the re-touch of 0.90854. Usually I don’t like to consider trades with such a small trading range – i.e., taking a put option when potential support is just four pips away. And often, when price is trading in a very tight range, it can likely break in either direction. This would effectively give yourself close to what I like to call a 50-50 trade, as in the outcome of a prospective trade can go either way. Obviously you would like to avoid those scenarios as taking 50-50 trades will lead to nothing but a net loss of profit over time.
But each market situation is unique. For that reason it’s hard to ever give set-in-stone rules regarding chart patterns. In this particular case shown in the image below, I felt a trade was reasonably justified. Price had been above resistance 2, followed by a break back down below. As the market came back up to resistance 2, it touched, went above, and closed back below. On the following candle, it did the same thing and closed as a red, bearish candlestick. This still wasn’t enough evidence for me to consider the trade, so I continued to wait, but saw the same thing on the following (2:15AM EST) candle – a test of resistance 2 followed by a rejection. On the 2:20 candle, I knew that the next expiration on the USD/CHF would be on the following candlestick. Therefore if I was ever going to make a move on this trading scenario I needed to act on getting in at my desired price (0.90854) on the 2:20 candle. The 2:20 did come up and touch 0.90854 again, where I got into a put option, expecting resistance 2 to hold for just a bit longer. Just over five minutes later, price had fallen by four pips and I had a winning trade.

The market made a re-visit to resistance 2 on the 3:00 candle. Normally one might think this would be a great opportunity to get into another put option trade. But when I trade I’m always very mindful of momentum, which suggests increasing volume in a market. When high volume starts coming into the market – which may often be induced by news events or anything that has macroeconomic implications – then prior technical cues don’t matter as much, if at all.
The 3:00 candle was a big five-minute price move relative to the 1-3 pip range price bars that had been occurring earlier. Even the weak 3:05 candle wasn’t enough to convince me that resistance 2 was going to hold. The level had already been broken earlier, and with increasing market volume it was likely to be breached once again. The 3:10 candle saw a large false break, a scenario in which the buyers (in this case) cause a break of the resistance level followed by a wave of sellers coming back in to keep price back where it naturally tends to reside (the resistance level). More often than not, the sellers’ “victory” in keeping the price back down on or below the resistance level is short-lived and the buyers eventually win this battle. All it takes is a larger influx of buying and often resistance is broken in pretty dramatic fashion with price quickly flying up to new highs.
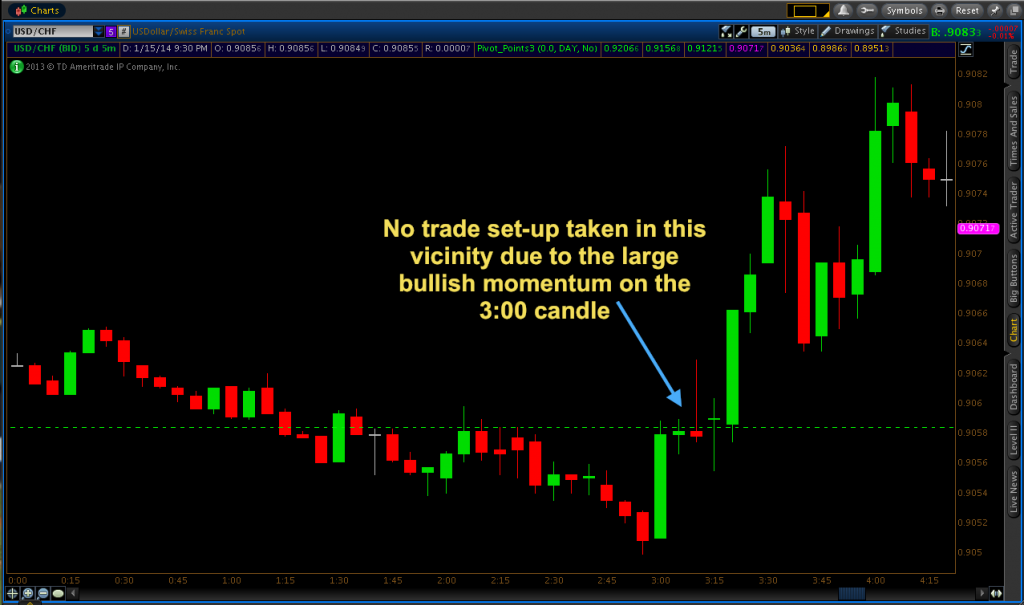
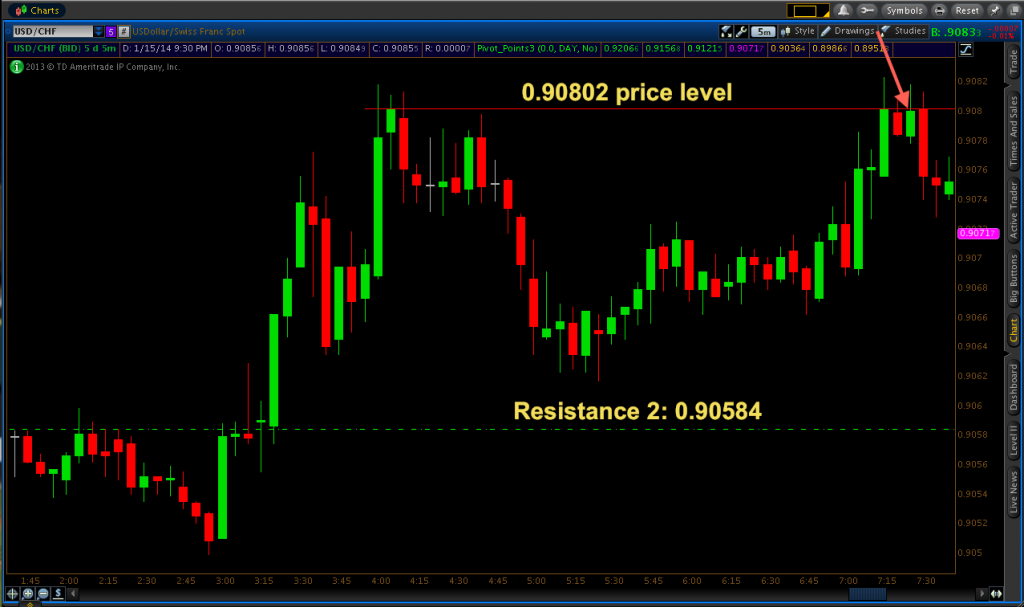
This is precisely what happened in this scenario. Price quickly rose by fifteen pips before a brief cool off, followed by the establishment of another new daily high and a new resistance level situated at roughly .90802.
After price retraced from 0.90802, my focus was on resistance 2 (0.90584) for call option set-ups and the new resistance level created from the daily high (0.90802). Price did not retrace down far enough for call options to set up. Due to the overall uptrend, I would have felt pretty confident in a resistance 2 call option scenario assuming it set up right.
I wasn’t able to get another test of 0.90802 for over three hours, but it was worth the wait. On the 7:15 candle, price touched the level and settled right around it. The next candle was bearish, showing that some rejection of 0.90802 could be in store, at least temporarily. My plan was then to take a put option on the next touch of that level, which happened to be on the very next candle, for a 7:45 expiry. This trade went in my favor the entire way and won by six pips.
The main takeaway point I’d like to emphasize from this post (at least regarding the two market scenarios covered by the first two images) is that no two market scenarios are ever alike. I believe the strategy that I cover in all my binary options trade posts is fairly simple to grasp. But actually putting it into practice and having success with it can take a lot of daily exposure to the markets over a long period of time.
I believe you can get 80% of the way to becoming a good trader in a short amount of time (e.g., less than three months of regular dedicated study and practice) if your strategy/system, money management, and psychology is in reasonable order. But to get the remaining 20%, it can take a long time to learn the nuances of market behavior, which in itself can deviate depending on the asset being traded and on the time of day that it’s traded. Don’t take these percentages as gospel by any means. I personally don’t like talking in percentages like that, such as trading is X% this and Y% that. But I believe the basic point holds true that you can advance to a certain level in a relatively short amount of time, but getting to a level of remarkable skill can take years or decades.
Learning the nuances of individual market behavior can be the difference between being a 55% ITM trader versus a 70%+ ITM trader. I personally don’t have it down perfectly, but all that I’ve learned so far is all communicated in my blog to the best of my ability. It can take a lot of time to become good at trading like anything else. You don’t pick up a game like football/soccer and become a superstar at it in months or a year. It takes multiple years of continually refining your technical skills before you can claim to have maximized your skill set to the best of your ability. The same goes for trading.