Interpreting Price Data: Magnitude and Velocity
When monitoring price action, and using it to find and filter trades, understanding magnitude and velocity will likely have a great impact on your trading success (or failure if you don’t understand these concepts). These terms are simply used to refer to how far the price has run in a particular direction–magnitude–and how fast it covered that distance–velocity. By monitoring both these factors, you’ll likely enhance your performance by finding high probability trades when certain conditions materialize, seeing when trends turn on strong moves, and avoiding times of choppy low magnitude and velocity price action.
Magnitude
Magnitude is simply how far a price run is. A long run, where the price moves relentlessly in one direction for a long period of time has a strong magnitude, and is what we want to see during trending waves.
Magnitude can also be used to interpret small waves. Price waves of small magnitude show that the price isn’t moving strongly in that direction, and therefore we want to see price waves of small magnitude on pullbacks.
There is no set magnitude reading which will indicate a strong buy or sell reading. Rather it is always relative to prior waves. There are multiple ways to use magnitude for interpreting price action.
- Waves of large magnitude in the direction of the trend confirm that trend.
- Waves of large magnitude against the trend direction indicate a potential reversal, or at least a significant pullback, is underway.
- Waves of small magnitude in the trending direction indicate the trend may be losing steam, since the trend can no longer produce waves of large magnitude.
- Waves of small magnitude on pullbacks (against the trend) indicate a healthy trend and the trend is likely to continue after the pullback completes.
Think of magnitude in degrees. A very strong wave carries more weight than a strong move. A very small wave shows an even greater lack of conviction than a small wave.
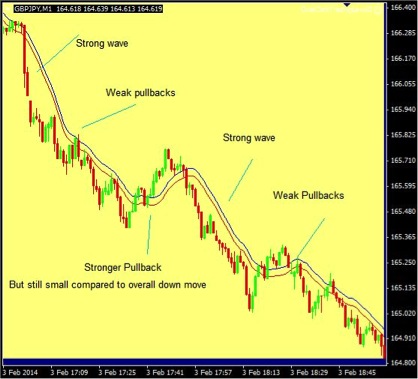
Figure 1 shows a downtrend in the GBPJPY on a 1 minute chart. Notice how the trend can be confirmed simply by looking at the magnitude of the price moves. Throughout the move lower the waves down were of greater magnitude than the waves higher, indicating the trend was likely to continue.
Figure 1. Using Magnitude in Downtrend: GBPJPY 1 Minute Chart
Velocity
Velocity also helps us assess price action, and is used in conjunction with magnitude.
Velocity is simply how fast the price covers distance. A very fast move shows more conviction than a very slow move.
Looking at the same downtrend, we can include velocity to confirm our expectations that the downtrend will continue. Moves down are not only larger, but they occur faster–taking less time to cover more distance. Having both magnitude and velocity occurring primarily in one direction is a powerful combination.
Figure 2. Using Velocity (and magnitude) in Downtrend: GBPJPY 1 Minute Chart
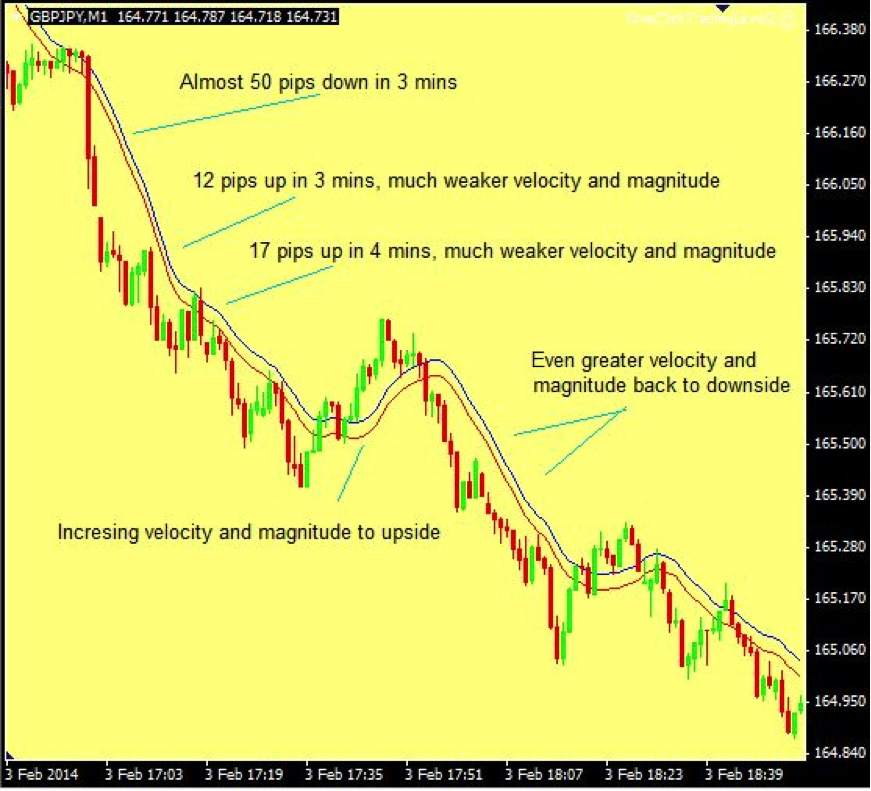
This provides compelling evidence that the downtrend will continue, until there is either a move higher that has greater magnitude than the major down waves, or a wave higher occurs with significant velocity (and respectable magnitude) that indicates buyers are once again entering the market with conviction.
Final Word
Magnitude and velocity are arguably two of the most important factors when assessing price action. Even so, it doesn’t mean you won’t have losing trades. It is simply evidence to help find and filter trades. Prices can always do erratic things, causing losses despite the evidence that is gathered. Always keep an open mind when trading, absorbing new evidence and monitoring the magnitude and velocity of new price waves as they form.