How to “Front-Run” Triangle Breakouts
Triangles are one of my favorite patterns; they are easy to spot, and even using a very basic approach (as outlined in Trend Continuation Patterns) can provide excellent trades. The basic strategy is to draw the outline of the triangle around the price (when the pattern occurs), and then wait for a breakout. There are ways to “front-run” the breakout though, getting in at a much better price which decreases risk and increases potential profit. If trading binary options, your risk and reward stay the same, but you can still use this entry method for finding additional trades or fine-tuning your strategies.
Triangles
Triangles are a common pattern where the price action is converging. There are ascending triangles, descending triangles and symmetric triangles, but for trading purposes they are all the same.
While some technicians are sticklers for how many times the price needs to touch the line, basically you only need 2 low points to create the lower line of a triangle and a 2 high points to create the upper line of a triangle.
Figure 1 shows a descending triangle in Apple (AAPL) stock. It is descending because the upper line is sloping down while the lower line is flat. An ascending triangle is when the lower line is sloping upwards but and the upper line is flat. Symmetric triangles occur when both lines are sloping towards each other.
Figure 1. Triangle Chart Pattern in Uptrend – Apple
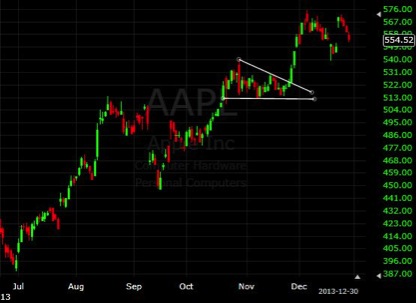
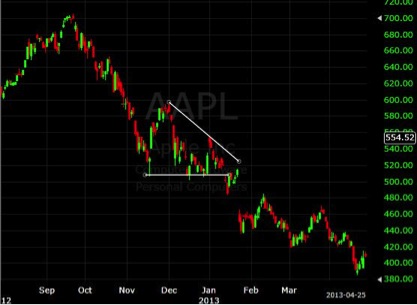
Figure 2 shows another descending in the same stock which occurred several months prior.
Figure 2. Triangle Chart Pattern in Downtrend – Apple
Traditional technical analysis methods tell us to wait till the price breaks out of the pattern before entering. That method is fine, although there is a way to reduce risk and increase profits by “front-running” the breakout.
Front Running Triangle Breakouts
The triangles in figure 1 and 2 were chosen as they are excellent candidates for front running the breakout. There is one main reason we can front run these triangle: the triangles were preceded by a very sharp and very strong move. If the triangle isn’t preceded by a sharp aggressive move we don’t front run the breakout.
In figure 1 there was a very sharp rally just prior to APPL entering the triangle formation. Because of that sharp move higher we can feel more confident that the breakout will also be higher.
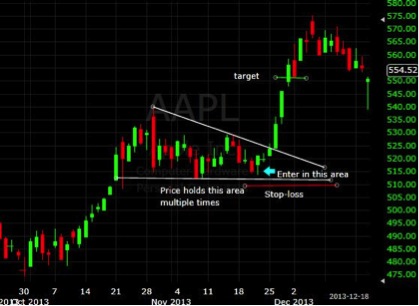
Therefore, we can enter near the triangle support. The exact entry point will depend on your specific entry method, but since we had a strong move up prior, and the price has held support on a number of occasions we want to buy near that support level. The assumption is that price will bounce off support again and breakout higher (although not necessarily immediately).
A stop is placed just below the triangle in this case (because we are expecting an upside breakout); not too close though. We are already getting a better price than if we waited for the breakout so leave the stop a bit outside the triangle.
The target is based off the height of the triangle; in this case the height of the triangle (widest part) is about $28, so add that to the eventual breakout price of $523 to get a target of $551. Alternatively a Fibonacci extension target could be used.
Figure 3. Front Running Triangle Breakout Strategy – Apple
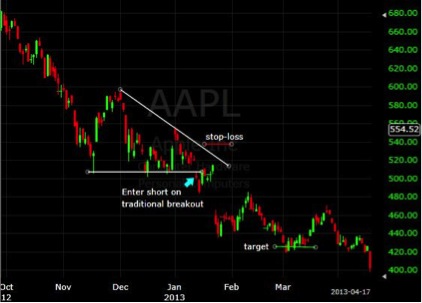
In figure 2 we saw another triangle. It occurred during a very aggressive downtrend. While we would have really wanted to front run the triangle breakout to the downside (because it was preceded by an aggressive move to the downside), in this case we would have had to trade it in the traditional way because once the triangle actually formed we weren’t given an opportunity to get in at an advantageous price.
Figure 4 shows this more traditional trade. Had the price pulled back to the upper band once again before breaking out, we would have been looking to go short near that upper band. That’s because it provides a slightly better price and the overall expectations is that the price is going to continue to drop based on the strong selling seen before the triangle.
Figure 4. Triangle Breakout – Apple
Final Word
If there is a very strong and aggressive move preceding a triangle, you can look for advantageous pricing by buying along triangle support in the case of expected break higher or selling/shorting near triangle resistance in the case of an expected break lower. While there are times we want to front-run a breakout, the market won’t always give us the opportunity. Front running reduces risk and increases profit, although we are making an assumption on the future direction of the price, which could be wrong…but even if we wait for a breakout it could result in a losing trade, therefore I choose to front-run when I can.