How to Effectively Trade Against a Trend
July 23, 2014
The EUR/USD was stuck in a rut during Wednesday’s trading and nothing looked even remotely close to providing a solid trading opportunity. So I hopped over to my back-up pair, the GBP/JPY, which did have some interesting action going on. And just as a side note before jumping into the heart of the post, if you are like me and trade maybe just one pair for the sake of simplicity, having a completely different pair as a back-up (in the case the market is really bad) is probably the best route to go. If your main pair is the EUR/USD, yet your back up is the GBP/USD, you’re probably going to get a lot of the same action. They both represent two European currencies compared against the U.S. dollar. They correlate very heavily together, so if the EUR/USD is lazy and uninteresting, then the GBP/USD likely isn’t going to provide much solace. That is why I venture over the the GBP/JPY – a different European currency tied to an Asian (instead of North American) currency.
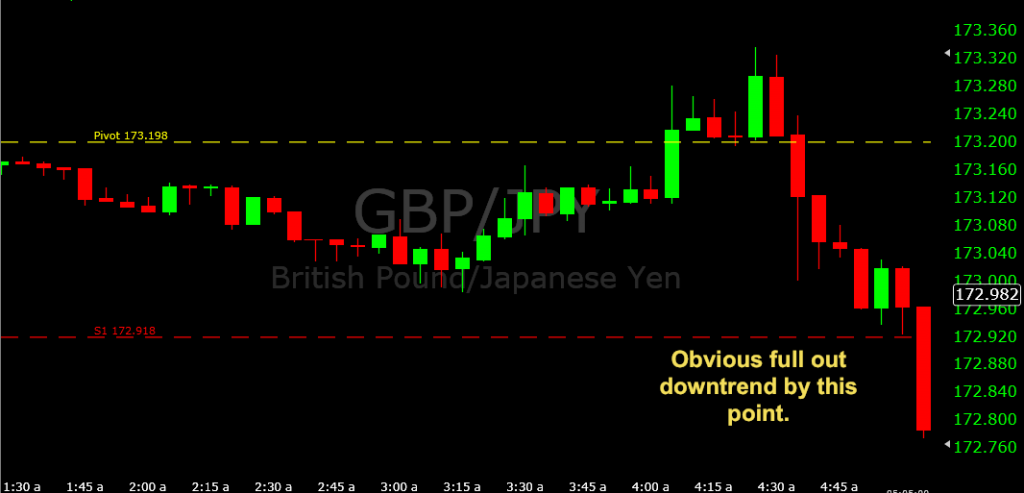
Just after 3AM EST, the pound/yen’s slow, steady move down fizzled out in favor of more buyers pushing it up and above the pivot after 4AM. But this up-move was not sustained, as a wave of selling came to the fore to push price back below pivot and engender a continuous downtrend. This is the one thing I particularly enjoy about the European session. Currency pairs often trend in a particular direction and move through or challenge support and resistance, providing trade opportunities based on the way I go about things.
Before 5AM, just north of support 1, there was some indication that some directional change could be in store. The 4:55 candle gained back nearly six pips and demonstrated that the market wasn’t bleeding entirely. The 5:00 candle came within a hair of support 1 before wicking back up a few pips. But price continued trending down below support 1 as well on a strong bearish 5:05 candle.
It wasn’t until support 2 that a reversal started to take shape. Whenever trading against a trend, you need to be careful because it’s risky. As always, every trading decision should be looked at as a business decision. Traders who treat their trading decisions like popping a coin into a slot machine, pulling the lever and hoping for the best simply will not be successful. Ideally, you want about at least twenty minutes of market action suggesting that the trend has petered out. I find that anything less than fifteen minutes tends to be overly high-risk, as it’s difficult to determine in such a short timeframe whether a strong trend might actually be coming to an end – at least temporarily to the point where you can reasonably expect a 5-20 minute trade working out.
On the 5:10 candle, price came shy of the support 2 level – 172.699 – and the next candle came up green, as did the next. After the 5:30 candle produced a 2-3 pip bullish move that rejected support 2, we finally had a good four candles (five minutes apiece) suggesting that this down-move has flatlined. Nothing is ever a certainty in trading, of course, but I actually felt confident at this point of actually taking a call option here.
Once price touched 172.699, I entered the call option, saw it go against me briefly before producing a good six-pip winner by expiration.
Bottom-line is that whenever you are up against a stiff trend, it is often best to avoid considering trades altogether until there is legitimate reason to do so otherwise – like the example posted in this article. A fair amount of time needs to elapse before you can possibly consider the fact that a trend might actually be discontinued, at least for the moment.
A general rule I have set up for myself is this period of time should be about four times as long as the amount of time comprising each candle. That is, twenty minutes after a strong trend demonstrated on a five-minute chart. There is nothing scientifically determined by this “rule,” but it’s something that I try to personally abide by to help slant the odds in my favor as best as possible when considering these type of trend reversal set-ups.


