Forex Day Trades – October 07
Here we’ll look at two day trades in the EUR/USD. The strategy used is a trend following strategy which I have been trading and testing on a 1 and 5 minute chart. For most traders I would recommend using it on a 5 minute chart since the targets are a bit bigger, risk is still kept small, and the trends are easier to spot.
Depending on which chart time frame you are watching will determine what trend you are interested in. For example, if you are trading a 1 minute chart, your main focus will be trends and trend changes on the 1 minute chart. Although being aware of the dominant trend for the day–as seen on a 5 minute chart–is also crucial.
In the EUR/USD the initial trend was up following the open, the trend then transitioned to the downside. Since I don’t start watching the EUR/USD till several hours after the open, the trend was down by that time.
The downtrend is determined by the price making a lower swing-highs and lower swing-lows; I have shown this with a downward sloping black trendline. The trendline is not important, it is just a visual to remind me that the trend is down. The lower-lows and lower-highs is what I am truly interested in.
Here’s one trade in the EUR/USD on a 5 minute chart, then we’ll go through a brief introduction to the strategy.
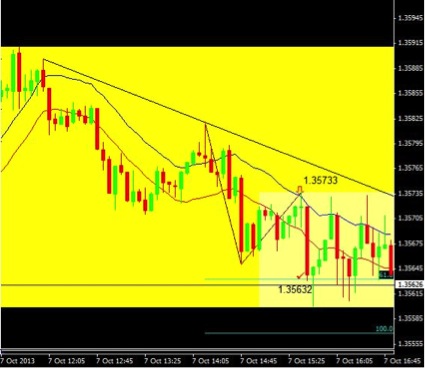
First off, the yellow area is the London session, and the cream colored section is the overlap period for the European and US session. The trade occurs during the overlap period (a signal also occurred prior to this, and shortly after).
The “flowing” lines on the charts are “envelopes”. On this chart they are set to 0.015%. These envelopes may need to be adjusted slightly each day based on volatility. In a downtrend we want the upper envelope to touch most of the high points in the downtrend-as this is what we will use an entry point (it’s ok if the price runs a few pips past).
The maximum stop on these trades should be about 6 pips, and in a downtrend (as shown above) we enter short at the upper band. I have drawn an arrow where this occurred, and marked the entry price (upper band) at 1.35733. The stop is initially placed for 6 pips immediately upon entry, but as soon as the price begins to drop again the stop is moved to the most recent high.
Since the price barely made it above the upper band on this trade, the risk was less than a pip since the stop was brought down to the recent high (at the arrow) once the price started to drop.
A Fibonacci extension tool is used to establish the profit target. Using the last wave down as the reference points for our Fibonacci extension we attain a target of 1.35632. This happens to be the 61.8% level in this case, but sometimes it may be the 100% level. We want to get out near the prior low, so whichever level happens to be closest to the low is the one we will use. This trade produced 10.1 pips.
It can be a very “active” strategy, resulting in lots of trades and lots of small profits…or lots of losses. It is also fairly subjective; since so many signals occur, it is important to trade with a trend, or be aware of the dominant trend when trading against it on a smaller time frame.
Another trade highlights this point. Just seconds before the prior short trade, the price had been moving higher on the 1 minute chart. This was against the dominant trend on the 5 minute chart, but there was still some opportunity there.
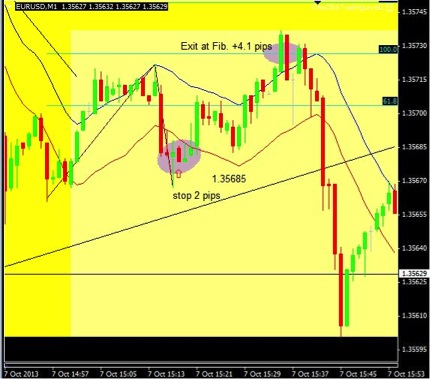
A long trade is taken at the lower band (long trades at lower band, short trades at upper band) with an initial stop at 3.5 pips (6 pips on 5 minute chart). Envelopes on the 1 minute are set at 0.01%, but once again may need to be adjusted slightly depending on market conditions.
Once the price moves higher the stop is immediately brought up to the last low, giving about 2 pips of risk on the trade. Once again we get out at a Fibonacci extension level, which in this case is the 100% level, for a profit of 4.1 pips. This is scalping-trade and therefore may be off limits to some traders, due to the spread or their broker not allowing scalping.
Following this trade, the next trade was to immediately take a short trade based on the overall downtrend. Trading against the trend is generally not recommended, but the trend is always relative to the time frame you are watching. If trading small time frames, always be aware of the dominant trend, since the downtrend continued with vigor toward the right hand side of the last chart.
Happy Trading