EURUSD Day Trades – January 28
Only one trade fulfilled my trade requirements during the late London and early US session, yet the trade is worth discussing since it encompasses many of the concepts I have discussed in other articles.
For about an hour before the US session began the EURUSD was moving predominantly sideways. Not price action I am interested in; I much prefer when the market has a directional bias.
As the US session begins there is a spike in the EURUSD on a US news release, which starts a potential trend. Trend trades are primarily what I look for and will be focus of this article. There are also ways to trade news releases, which could have been implemented following the release (See: Trading the News).
Figure 1. EURUSD 1-Minute Chart
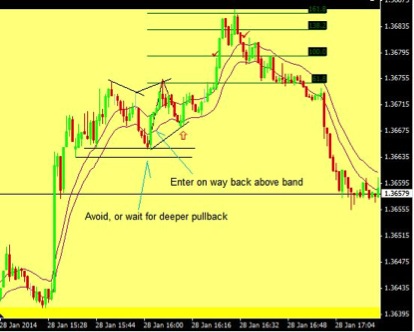
This charts shows a lot of information, so let’s work from left to right. Based on the envelope strategy (See Forex Day Trades-October 7 and subsequent posts) we are waiting for a pullback to the lower band, but must also watch price action to validate the signal.
Just before the lower band is touched for the first time (after the run up), the price made a lower high and is a making a lower-low as it reaches the lower band. This indicates a deeper pullback is underway (or a potential reversal if it takes out prior support–horizontal black lines). Therefore, we don’t have an order waiting to go long at the lower band. We either avoid this trade, or only buy it when it begins to move back higher. One way to enter this trade is to go long when the price moves back above the lower band.
In this case it would have worked out, especially since the deeper pullback held above prior support levels marked by the horizontal black lines.
The price then proceeds to make a new high and pulls back to the lower band. In this case, we do have an order waiting at the lower band (red up arrow). We have an order waiting because we can now see this is likely just a consolidation in an overall uptrend (See: Should I Hold Through a Pullback Part 1 and Part 2). Since the price tried to drop but couldn’t, then rallied to a new high (albeit only slightly) it is now quite likely that this pullback is just a brief reprieve before continuing to trend.
Entry points won’t always be this perfect, as the price barely moves past the lower band and then springs higher. A Fibonacci extension tool is used to approximate exits, although I always prefer to actually rely on price action for my exit points.
If using Fibonacci levels, the most applicable level is 100. A small red check mark indicates this exit point; a 10.5 pip profit for a 3.5 pip original risk which could have been quickly reduced to less than 1 pip. Moving to the right there is another check mark. If using a manually exit, this is where you’d be looking to get out. The price tried to move higher, but barely could and then we see a bearish engulfing pattern (ie. short-term shift in momentum).
Final Word
Paying attention to price action and being patient can pay off. Sometimes there are lots of trades in a few hour span, and other times there aren’t many. Don’t change your strategy every day just to try to get in as many trades as you can, focus on what you know. Better to make a profitable trade or two on something you know than to start experimenting and end up losing on a bunch.