Convergence As Confirmation
Convergences are a powerful indicator for traders of all varieties. Convergences, as the name suggests, are when two or more indicators or other analysis devices are leading you down the same path. Imagine a stream flowing down a valley. It meanders along on its own, following the trend of elevation until it joins, or converges, with another stream. Together these two streams become a river that flows down the mountain, also following the trend until it converges with yet another river becoming a much stronger and larger river. If you can think of an indicator, and by extension the traders who follow an indicator, as a river of money then it won’t be hard to imagine two indicators in convergence as two rivers of money becoming one much larger and liquid river. The more indicators that converge together the more traders who are following the same signal making it more powerful than other lesser signals. Most strategies utilize some form of convergence and confirmation in order to trigger.
Convergence of indicator with price action. This is the simplest of all convergences but perhaps the most important to watch for as it can impact a trend following or contrarian strategy. A convergence of indicator with price action means that as prices make a new high the indicator makes a new high as well. The same is true for new lows in a down trend. This type of convergence most commonly occurs with oscillators such as MACD, stochastic and RSI but can also be useful with moving averages and other types of tools. This type of convergence reveals strength in the underlying trend and means that prices are much more likely to continue higher or lower than they are to reverse. Think about it like this; the indicator measures the strength of the underlying market, if the market makes a new high and the indicator makes a new high it confirms increasing strength in the market and the underlying trend. Look at the chart below. Price action makes a new high that is confirmed by a high in the MACD. Prices correct temporarily but continue higher after reaching the trend line.
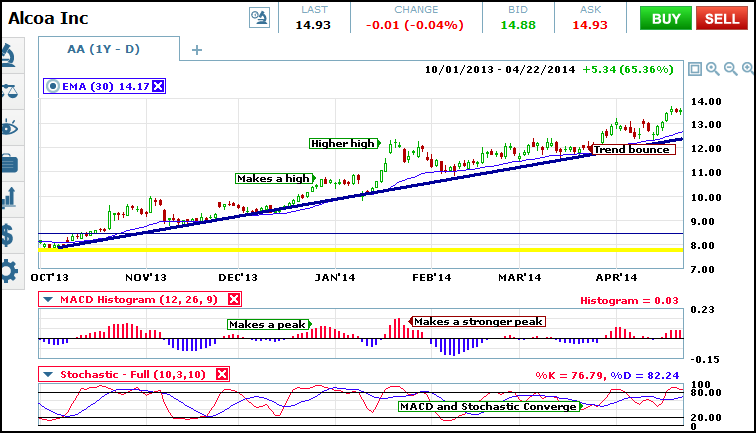
Convergence of indicators. From time to time indicators will converge as well. Usually this happens within a couple of days of each other and is usually referred to simply as a “confirmation” as in one indicator confirmed another. This can be when stochastic makes a bearish crossover at the same time MACD and/or RSI falls below the center line. This type of convergence is very useful for momentum and short term traders as it can often precede a rapid movement in the stock. Lot of traders use the individual buy and sell signals given off by trend following indicators, the more indicators confirming a signal at one time the more likely a sharp move is on the way. Look at the chart above. To the right side is marked an area where prices are being supported by the trend line. Then we get a convergence of trend following signals including MACD, stochastic and the moving average that lead to another move higher.
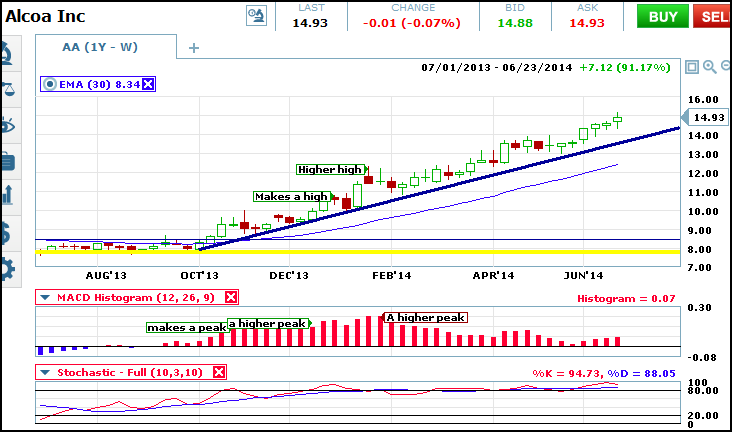
Convergence of time frames. All too often a good signal fails because time frames were not considered. It is possible for a trend in one time frame to overpower a trend in another the way one incoming wave overpowers another as the tide rolls in. A convergence of time frames is when the underlying trend in one time frame matches that of a shorter or longer time frame. For example if an asset is moving higher on a stochastic crossover on the charts of weekly prices a similar bullish crossover on the daily charts has a much higher chance of profitability than a bearish one. This is simply trading with the trend and a powerful confirmation of trade signals. The chart below is a longer term chart of the same asset shown above. Notice how the MACD on this chart confirms price action and the daily chart, leading to a prolonged up trend in the asset.
Convergence of Indices. The market is a vast place filled with many types of stocks, commodities, currencies and etc. The indices were created to follow different portions of the market. The S&P 500 measures the broad market of large companies. The Russell’s measure small businesses, the Dow Transports measure transportation related stocks and the Nasdaq is filled with technology related companies. Because there are different reasons to be in one type of stock or another and those reasons change from time to time it is rare for the indices to be in tandem, even when they are all trending higher. A convergence of indices is when two or more of the major indices are in tandem and could lead to a big move in all stocks.
Convergence With Index. This is when an individual stock is trading in tandem with the underlying index. For example Apple and the Nasdaq. If price action and indicators for Apple are convergent with the indicator on the Nasdaq there is a stronger chance of the signal paying off than if the two were at odds with each other. In this way the underlying market sector and the individual stock are confirming each other. A good way to find lots of high probability trades is to wait for a signal on an index and then scan the underlying stocks for similar signals.
These types of convergence are not only powerful confirmations of signals they are also great ways to find trades. Once you begin to recognize them with confidence you can then look for them on any chart or time frame you choose. In fact, I highly recommend using these techniques any time you are entering a trade. Once you identify a signal look for some convergences. Are there any to help confirm your original signal or do they tell a different story?