3 Currency Pairs to Watch as We Enter 2014
USDCAD: heading for a Bearish Reversal into 2014
2013 saw the USDCAD currency pair soaring over 900 pips. Will bulls continue charging into 2014? Maybe not, as we think there is a good chance this pair is heading for a bearish reversal. The chart below paints the USDCAD MT4 daily chart, using Ichimoku analysis, with the RSI plotted in blue below the chart.
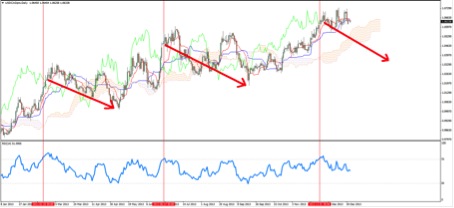
Technical indicators used on this graph suggest bearish reversal proponents. The first signs of overbuying is indicated with the RSI line going above the 70 level, while one of the earliest signs of bullish reversals for Ichimoku analysis is the lime green lagging Chikou Span piercing below price. The red vertical lines above indicate the last 2 times these 2 indicators concurrently suggested bullish reversals, and each time there was a correction of over 200 pips. It looks no different this time around and there is high probability of a downward move soon.
AUDUSD: 3 reasons to be Bearish into 2014
2013 saw the AUDUSD currency pair plummeting over 1,600 pips. Will bears continue stomping into 2014? We think so. The chart below paints the AUDUSD MT4 daily chart, using Ichimoku analysis, with 3 moving averages plotted over the chart.
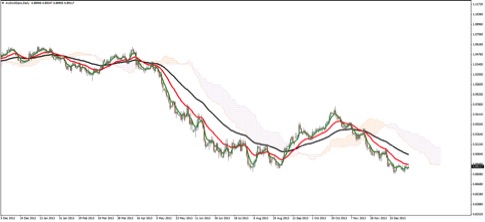
Technical indicators used on this graph suggest a good number of bearish proponents:
- Prices are below the 52 period exponential moving average (EMA) in black
- The faster moving 5 period EMA in green is below the slower moving 20 period EMA in red
- Kumo clouds in orange and purple are painted across the chart, and these serve as resistance zones above prices. The purple downward sloping future kumo looks to be thickening, offering greater resistance
It looks like clear skies ahead for the bears with no kumo shadows behind prices. Prices will remain in bearish territory unless the 5 period EMA crosses above the 20 period EMA, prices go above the 52 period EMA, and prices break above the Kumo cloud.
EURUSD: 5 reasons to be Bullish into 2014
The 2nd half of 2013 saw the EURUSD currency pair rally over 1,000 pips. Will this rally continue into 2014? We think so. The chart below paints the EURUSD MT4 daily chart, using Ichimoku analysis, with the RSI plotted below the chart in blue.
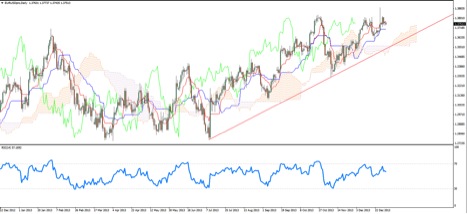
Technical indicators used on this graph suggest a good number of bullish proponents:
- The high of February 2012 at 1.3711 was broken only recently in October 2013, and broken again in December 2013, suggesting formidable bullish momentum.
- The kumo cloud painted in purple and orange across the screen serves as a support, with prices above the kumo. There was an attempt to break below the cloud in November 2013 but this was quickly reversed. The future kumo in orange looks bullish and it is thickening.
- The Kumo also coincides with the red support trend line drawn diagonally across the chart, and this trend line should support prices.
- It is pretty much clear skies ahead from the Ichimoku lens, with no kumo shadows behind prices, and prices on the uptrend. It is worthy to note the lime green lagging Chikou Span behind prices though; if this breaks below prices, we can expect some turbulence and consolidation.
- The last time RSI broke above the 70 level was in October 2013 and since then, there is no RSI suggestion of the EURUSD being overbought. Bulls can hold their horses if RSI breaks into the overbought region above 70.
This is a guest post from our friends at Streetpips.com. They scan books and websites for trading strategy ideas and then select those which are programmable, code them, and share these with their members.