Beginners Trading Concepts: Using Trendlines Effectively
Trendlines are an analysis method that every beginning trader should take the time to learn about and understand. Using price history to analyze the market is a powerful way to trade, as price is the only true indicator of market direction, upon which profits are made or losses realized. Trendlines are one tool used to analyze markets; they help you determine when trends are underway, when price is stagnant–and not worth trading–and when the price direction may reverse. Trendlines are used by traders of all levels, and even basic trendline concepts can be transformed into excellent trading strategies for those who take the time to study them and their applications.
Price Movement
Price rarely moves in one direction for long, rather it is constantly moving both up and down. Trends in price develop when buying is more powerful than selling, or vice versa. An uptrend occurs when the price reaches new highs as it rises, and when it falls manages to stay above former price lows. A downtrend occurs when the prices reaches new price lows as it declines, and stays below former highs when it rises. Figure 1 shows this concept visually for an uptrend–both the price swing lows and highs are higher than the former swing lows and highs.
Figure 1. EUR/USD Daily Chart
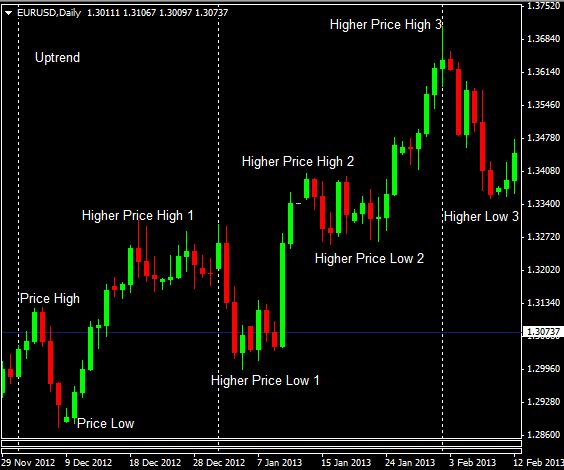
Source: Oanda – MetaTrader
Drawing Trendlines
The up and down movement of an assets price creates trends, such as the uptrend shown in figure 1. To make it easier to see an uptrend or downtrend, a drawing tools–available on nearly every trading and charting platform–can be used to “highlight” the trend. By drawing a line to mark price trends, you can also clearly see multiple trends which may be occurring on different time frames. This is very useful when switching between a daily chart and an hourly chart for example, as you will be able to see the trends which are in effect on both timeframes, providing additional insight for you to consider before trading.
Draw a trendline for an uptrend by selecting the “trendline” drawing tool in your trading/charting platform. In the case of uptrend, start drawing the trendline where the trend begins (a low point), and then extend the line so it runs just below the price lows that follow. For a downtrend, again start at the beginning (a high point) and extend the line down along the price highs that follow, as shown in figure 2.
Figure 2. EUR/USD Daily Chart with Trendlines
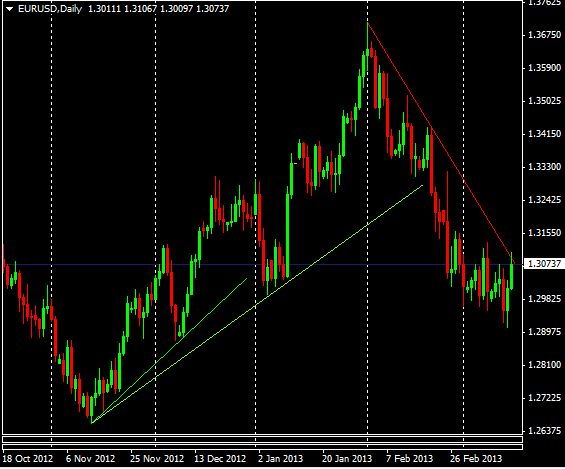
Source: Oanda – MetaTrader
Adjustments Are Often Needed
The left side of figure 2 shows an uptrend, although two different trendlines have been drawn to show it. When trading in real-time trendlines often need to be redrawn or adjusted. In figure 2 the price drops below the first trendline (shorter green line), but is actually still in an uptrend since the price low is higher than the former price low. Therefore, once this occurs and the price starts moving higher again, the trendline can be re-drawn (longer green line) to reflect the new information and accommodate the new price low.
Such adjustments and redrawing of trendlines occur often. Price doesn’t move in perfect harmony, where each up and down movement is exactly like the last. Trendlines only provide a rough estimate of the trajectory of a trend.
Using Trendlines
Trendlines are typically used to highlight trends and signal potential price reversals. When a trendline is broken–price moves through it instead of respecting it– the trend may be reversing. Although, since we know trendlines often need to be redrawn or adjusted, the breaking of a trendline is not usually a buy or sell signal in and of itself, although it can be. Toward the right side of figure 2, the uptrend is broken by downward price movement. A downward trendline can then be drawn (red line), indicating the price has shifted into a downtrend for the time being. The price also created a lower low than the prior swing low, providing further evidence that a downtrend is underway.
A trendline is also used to indicate potential price areas of support or resistance. When price is in an uptrend, use the trendline to gauge when a correction will stop declining (support) and the price will begin to move higher again. In a downtrend, use the trendline to gauge when the price may stop rising (resistance) on a correction, and begin declining again. The price “bouncing” off a trendline in this manner can be used as the basis for a strategy. It’s unlikely though that the price will stop exactly at the trendline. Use the trendline simply as a guide; the price may stop just short of the trendline or just beyond it, therefore some flexibility is needed when using trendlines.
Figure 3 shows this strategy in motion. As the price moves up toward a descending trendline, and then begins to decline again–effectively “bouncing” off the trendline–a short trade, or option put trade is made.
Figure 3. EURUSD Daily Chart with Trade Signals
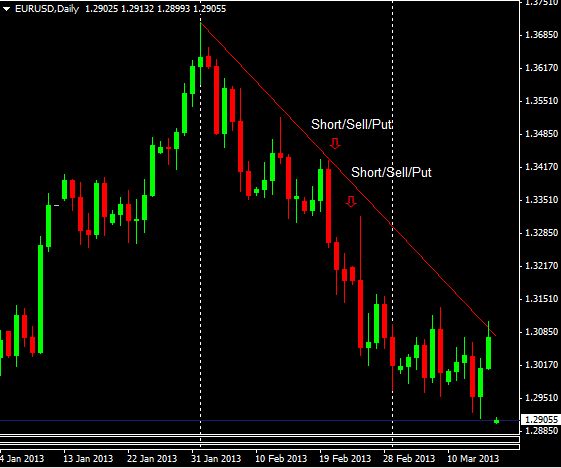
Source: Oanda – MetaTrader
Final Word
Trendlines, like all other forms of analysis, are not perfect. Often trendlines will need to be redrawn which means that if you used them for providing trade signals, some losing trades will occur. Trendlines do provide a good context for price movement though. A trendline can help estimate the future price trajectory, and also warn you when a trend may be reversing. Remember that trends occur on multiple time-frames. For example, the price may be moving in an overall downtrend on the daily chart, but an uptrend on the 15-minute chart. By looking at both longer-term and shorter-term trends, you can gain greater insight into the likely future price movements of the asset. This can result in filtering out some “bad” trades as well as seeing potentially profitable trades you may not have seen by looking at only one timeframe or trendline.