Aug 9 NQ – one hold & one breakout.
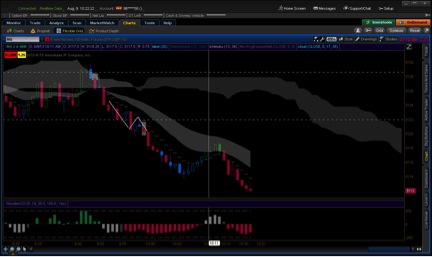
Dashed lines are the top and bottom of the first five-minute open range for the NY session. At about 9:45 price moves with incentive to the range top & Kumo top, coincident with extended momentum. The next candle is a nice stall Doji followed by a decent down candle confirmed by a rejection of extended momentum. I don’t enter there though because the candle is not red. I risk missing it but more likely (in the case where the market will make a down move) the next candle will move into the range of this blue candle & then break out, ending as a red candle. In this kind of spot I take it at the break of the blue candle – that’s my balance between price risk & information risk while sticking to a standard. Hope is to reach the bottom of the open range and it gets there.
Second trade is standard break with incentive, drift back & continue with incentive. The ideal momentum indicator pattern for this price pattern is to go from strong one side to strong the other followed by a rejection of the zero line. The rejection here is not at the zero line but it’s okay in the context of the other factors.
I didn’t enter the next nice move down that starts at the RHS. I didn’t like the momentum indicator & I didn’t like that it’s potentially late in the move. It looked more to me like a double bottom formation. You could of course watch multiple time frames & possibly see an entry. It’s just a matter of style, personally I get confused by multiple aggregations & tend to do better watching other symbols all on aggregations that make sense for my account size. I did catch a nice 20 pips in 6B earlier this morning – can’t get them all.