A Basic Look at How to Differentiate High-Probability from Low-Probability Trade Set-Ups
August 13, 2014
In the past, I was more aggressive in my trading in that I would often take trades on the first touch of a particular price level. But this still did not mean that I would only trade just a price level. Just because a particular pivot point is coming into view for the first time for the trading day shouldn’t be an indication to get overly excited and hop on it right away.
I do realize that if one has been sitting in a chair for a fair amount of time with absolutely no market action, then it can be difficult to not get antsy and want to take a trade. But sitting on your hands when appropriate and not taking set-ups you know you should not be taking is a big part of the equation when it comes to trading well.
In this post, I’d like to specifically address what kinds of things you need to look for when determining whether a trade set-up is worth taking. By that I mean whether the chart evidence suggests that the probability of winning that trade is sufficiently high to merit taking it in the first place. Both examples used in this article are taken from the EUR/USD European morning session on August 13, 2014, a market that I personally traded.
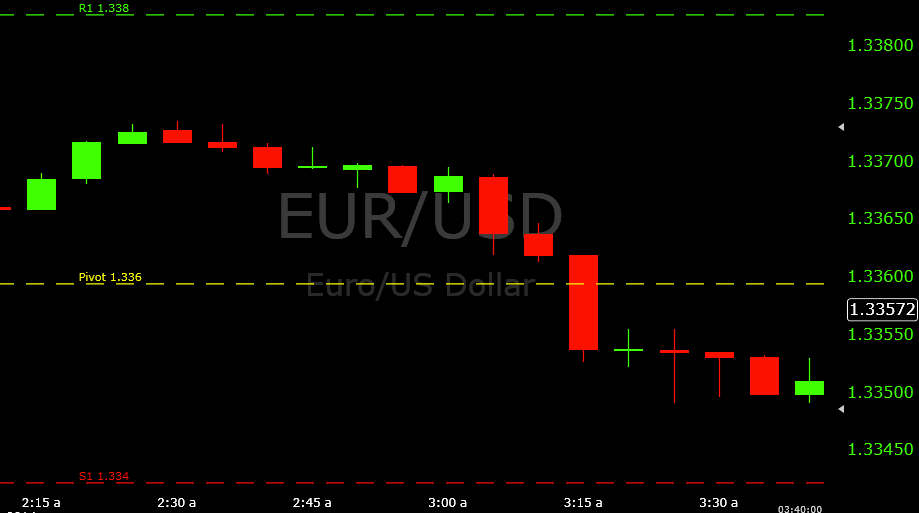
1. First, I would like to take a look at a low-probability trade set-up:
In this example, an hour after the open of the European session (2AM EST) saw more bearish/downward motion occur as the market began falling down to the daily pivot level. The 3:00 candle began the initial selling thrust. Of course, here at this hour we’re only talking about a five-minute candle with a seven-pip range. But relative to the preceding candles, the market is indeed waking up out of its slumber.
It’s always vital to be aware of how volume is flowing into a market. It’s arguably more important to understand when it’s entering, given that trading based on recent technical factors (e.g., price levels created from previous price history) may not hold up as well. Moreover, it’s important to ascertain when volume has the chance of flowing into the market. Or is guaranteed that it will. By this, I mean news releases.
Common news release times are at 4:30AM EST and 8:30AM EST. Obviously you don’t want to take a trade at 4:28 for a 4:45 expiry if there’s going to be news released at 4:30. That turns your trade into a 50-50 gamble, because whatever evidence you used to support taking a trade will go flying out the window during news time. As anyone with day trading experience will know, as soon as the clock hits that particular time during a major news release, the market goes haywire instantly and support and resistance levels, price action, previous trend, etc., all go flying out the window during this event.
But going back to the example in question, this wasn’t an instance of a news release or anything of the sort. It was simply market volume picking up a bit as more traders enter the market. 3AM EST will have more market activity than 2AM; 4AM will have more activity than 3AM; and so forth.
The 3:10 candle was also bearish. Despite the fact that it had a lesser range than the 3:05, never let something like that suggest that the market is stablizing and that the price level is likely to hold. Sometimes there’s a bit of a “calm before the storm” type of phenomenon before tests of important levels in the market. And, as the image above clearly shows, the 3:15 went through pivot convincingly by producing about a ten-pip range.
This is the reason why I always wait for a bounce first as confirmation that price is likely to hold. If you’re electing to take this trade set-up, you probably have a chance of this working out barely over 50% of the time. Simply because you don’t have a lot going for you here.
You have the price level and… well, that’s basically it. You always need to consider the price action. How is price acting around the level you’re targeting? Is it actually show indications that it’s rejecting that level and a reversal could be in store, at least long enough to produce a probable winning trade? Support and resistance is your guiding force, but price action is largely what gets you into a trade.
So needless to say, this certainly qualifies as a poor trade set-up even if you are more aggressive in your trading. It’s fine to be reasonably aggressive. But to me, taking this set-up would just be a bit too reckless. The profit margin would almost surely be non-existent/negative taking set-ups like this regularly.
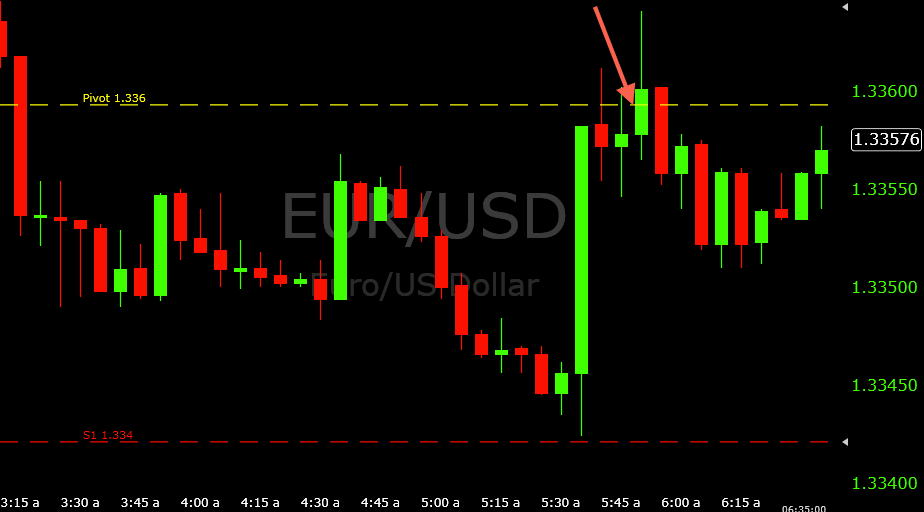
2. Next, to fulfill the opposite end of the bargain, I would like to take a look at a high-probability trade set-up.
Obviously, if you are acquainted with my blog, these are the type of trades that I discuss regularly. The ones that I provide rundowns and analysis on represent types of set-ups that you can look for to win consistently. Yes, you will have good days and some bad days, and might be bored not taking trades for several hours, but truly high-probability set-ups are not totally common. And that is, by nature, why they surface infreqiently.
In this set-up, the fall through the pivot eventually saw the market nearly reach support 1. It did not hit, given that some important news was released at 5:30AM EST. Again, it is important to regularly check your economic calendar, and begin to understand what times and what types of news releases affect the market.
In this case, it was the Bank of England inflation report. It came back as a “high” reading (i.e., a higher than expected inflation rate), and the five-minute candle respective to this news release on the GBP/USD had a 100-pip range, which is substantial and rarely occurs. On the EUR/USD, the range was a more meager fifteen pips, but still notable in itself.
Nonetheless, on the following candle, the 5:40, price came up to the pivot level and rejected it. Given that there was no clear indication that the market had settled since the news releases, I waited to see what the next candle had in store and I had no intention of trading it. When the 5:45 candle also rejected the pivot and had less of a wick above the level than the 5:40, I now had full confidence in this particular put option set-up.
In addition to the price level itself, I had, to my advantage, price rejecting pivot on back-to-back candlestick occurrences on the five-minute chart. And no momentum or trend going against me. So on the 5:50 candle, I entered into a put option. This engendered a break above the pivot by about five pips, and a close above by a fraction of a pip. This isn’t what I ideally wanted, but this trade still had ten minutes to run its course.
But I had a nice drop on the 5:55 candle to put me a few pips in-the-money, before closing out about two pips in favor.
So to close, just remember that to support any trade set-up, always look for at least two factors to support your trade. The more, the merrier. Never just take a trade because it hits a support level or because a doji formed or something of that nature. The greater the confluence of factors you have supporting your trades, the higher the probability they have of working out. And when you’re slanting the odds in your favor and executing these trades consistently, you can certainly trade well and turn a profit in the process.

