4/6 ITM using daily pivot points and fibonacci retracements
Monday turned out to be a really good trading day and I got a lot of help from the only technical indicators that I use for binary options trading – daily pivot points and Fibonacci retracements. When I started watching the pair around 2:30AM EST, the USD/CHF was in an uptrend after consolidating around the pivot level of 0.92838 (purple line on chart) during the very early morning.
As it was heading up, I had my sights set on two different levels as potential areas of reversal. One was the 78.6% Fibonacci retracement (drawn from the price move 0.91748-0.97500) at 0.92979. That being said, I tend to not place a lot of emphasis on the 78.6% Fibonacci retracement level. It doesn’t seem to hold as well as the 23.6%, 50.0%, and 61.8% levels on both short-term and long-term timeframes. The reason is that it simply isn’t used as much as those aforementioned levels. In fact, many trading softwares don’t even have the 78.6% present on it’s Fibonacci retracement drawing tool. Some use 76.4% (reverse of 23.6%), although the 78.6% does have actual relation to the Fibonacci sequence in that it’s the square root of 61.8% when expressed as a decimal. Either way, I place less attention to the 78.6% than I would to others.
Price went right through the 78.6% Fib on its first try and even went above the 0.9300 whole number and the green resistance 1 line (0.93041) on the following candlestick before wicking back down. The action of it wicking back down told me that resistance 1 would likely indeed serve as resistance should it get back up to that level again.
About twenty minutes later, price re-touched resistance 1 on the 3:15 candlestick, but I did not immediately take a trade. If the trend was down or neutral, I would have had no issue with taking a put option on the touch of resistance 1 (0.93041). But given the trend was so strongly up at this point and the re-test of the 0.93041 level came after a weak retracement (only dipped down about nine pips after a 25-pip move), I decided to wait for it to wick back down again to see if the level would still hold. Indeed, that’s acting very conservative, but I wanted to get all the confirmation I possibly could that resistance 1 would still be likely to hold. Plus, I still had over ten minutes before the expiration of the trade so there wasn’t necessarily any reason to rush it.
After the close of the 3:15 candle, however, my price feed very inconveniently froze on my ThinkOrSwim software. So I immediately opened up one of my MetaTrader4 platforms and began watching the USD/CHF on a plain five-minute price chart. Once I saw price touch 0.93401 on MT4 I entered my first trade of the day, a put option, and saw the trade do nothing but continuously go in my favor the whole time. I wound up with a nine-pip winner, which is great for a relatively tranquil time period.

The market continued to move lower after the trade. I didn’t have any clear idea as to where potential call options could set up. I was thinking possibly back down at the pivot level of 0.92838, as price had shown some sensitivity to that point in the market earlier. For put options, I was considering the 78.6% Fib retracement or either back up at resistance 1.
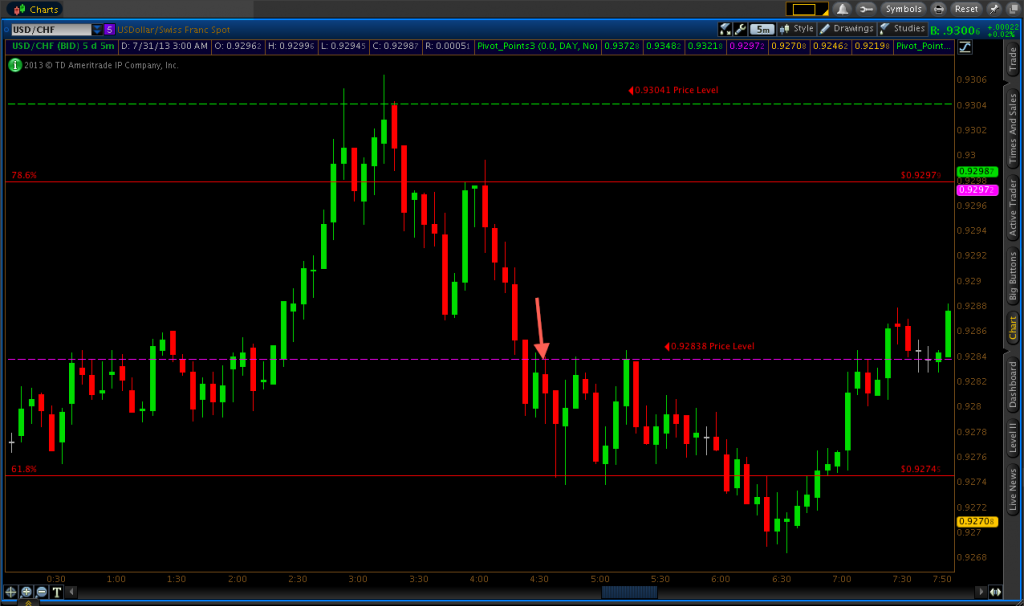
The 78.6% Fibonacci line became the next possible set-up when price touched 0.92979 on the 3:55 candle. The next candlestick did not re-touch the level but did form what is typically referred to as a “hanging man” candle and can indicate upcoming reversal. When price re-touched 0.92979 on the 4:05 candlestick I took a put option. This produced a six-pip winner.

Following that, I considered 0.92873 for put options (from previous support made on the 3:45 and 3:50 candles), but price fell through that level on the 4:20 candle. The market also fell through the pivot point on the next candle. At this point, I had my eyes set on the pivot point for put options and the 61.8% Fib retracement level (0.92745) for call options. A support level did exist about halfway through that channel based on the price action from earlier in the morning. However, in a period of greater volume in the market, I fully expected that to be breached in favor of the 61.8% Fibonacci retracement instead.
After the break of the pivot level, price came up, re-touched, and rejected 0.92838 on the following candle. Therefore, given the price action pattern and the overall recent downtrend, I took a put option at the touch of the pivot on the 4:35 candle. This trade went in my favor the entire time and was up by ten pips at one point before settling as a six-pip winner.
My next trade came right after on the 4:45 candle using the 61.8% Fibonacci retracement level for support, after it was strongly rejected on the previous candle. This Fib line was actually relevant to a different price move (0.70675-1.06387) that represents the top and bottom of a very large amount of price data viewable from the weekly time compression. Hence, a Fib level showing up from such a significant price move is very likely to be respected. In fact, price had been gravitating around it very often within the past day and I had set a buy limit order at the exact level in my spot forex trading. This call option trade won by seven pips.
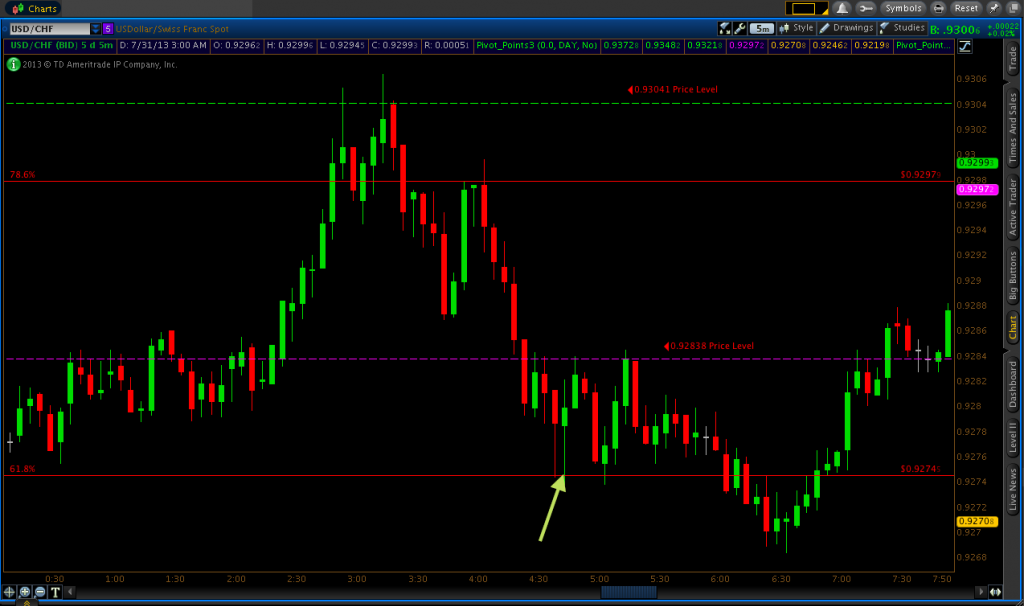
After this trade, a channel formed between the daily pivot level and the 61.8% Fibonacci retracement. However, I refrained from further trades at these levels as I wasn’t getting a touch/reject/re-touch pattern to form. The market eventually broke below the 61.8% (0.92745) level on the 6:15 candle, and re-tested it again on the 6:25 and 6:45 candles. Once price re-touched the level again on the 6:50 candle, I entered a put option on the touch of 0.92745. I expected the level to hold to the downside due to the 61.8% Fib acting as resistance in addition to the trend being down. However, I ended up losing this trade by one pip, as price broke back above the 61.8% Fib. In hindsight, the fact that the put option did not work out seems pretty clear based on the fact that the market simply did not move below it very much. In other words, there simply were not enough sellers to drive the price down further, and hence why the 61.8% Fib only saw five pips of downward action beneath it. So even though I lost the trade, I still felt I learned something from it that could make me a better trader. It’s an old cliché that we should always strive to learn from our mistakes and it’s something that I feel holds especially true with regard to trading.

My final trade of the day, a put option, came back up at the pivot point of 0.92838 on the touch of the level on the 7:15 candle, as price had rejected the pivot on the preceding candle. This trade was in my favor until near the very end, when price went above my entry and closed just over two pips against me.

While I did end up losing my last two trades of the day, I was very happy with how things played out overall. Six set-ups in five hours on one asset is definitely an indication of some favorable price action based on my personal approach to trading binaries.
This was a bit of a detailed post and I can see how it could become confusing if the screenshots aren’t enough to sort things out. So please never hesitate to ask about anything regarding any of my posts or with regard to trading, in general. I’ll always do my best to reply back in a timely manner.