3 Profitable Continuation Signals For Binary Options
One of the oldest adages in the market is that the trend is your friend. This means that, for best results, traders are better advised to trade in line with underlying market direction rather than bet against it. In terms of trading this means that trend following signals are the ones you really want to use. One method is to use reversal signals to pinpoint corrective peaks and troughs during a trend in order to predict entries. This strategy works well when the market is making peaks and troughs but sometimes it isn’t, sometimes the market is trending strongly in one direction so what do you do then? You target continuation signals, signals that indicate underlying strength in the market and a follow through of current trends.
- Tip – Candles signals are best interpreted using three criteria; relative size, volume and location relative to support and resistance. Candles should be noticeably larger than average with high or rising volume. In this case, bullish continuation signals are best taken when asset prices are rising from support or breaking through resistance and bearish signals should be taken when prices are falling from resistance or breaking through support.
Three Continuation Signals Binary Traders Should Know
Rising Three Methods – I like this one a lot for two reasons; it has a cool name and is easy to spot on a chart. Believe, once you learn it it will pop at you when it forms. This is a 5 candle formation and one that requires a close of the final candle in order to be valid. This pattern can be bullish or bearish. In an uptrend the first candle will be a long white candle that closes near its top. It can be shaven topped but does not have to be. The next three candles will be spinning tops. They will be small, can have white or black bodies, will usually fall over the course of three days and not move below the low of the first candle. The fifth candle, the important one, will be another long white candle. It will usually begin above the low of the first candle, close at the high of the day, and have the highest close of all five candles, most likely a new high for the current trend. Once completed this signal has a better than 70% success rate with expiry equal to 2-5 candles from purchase (5 minute candles equals 10-25 minute expiry).
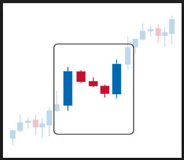
Side By Side Lines – This is a two bar pattern with a high degree of success. It forms when two long white, or black, candles form side by side. In an uptrend the first candle will form at the high of the movement, be a long white candle, close near the high of the day and come with high volume. The second candle will open at or near the same level as the first candle, form a long white candle, have high volume, close at or near the high of the day and may close above the first candle. These two candles are indication of building strength and often precipitate sudden, extreme movement in prices as traders rush to get in.
- Tip- Signal strength is relative to time frame. Signal in larger time frames such as one hour versus 5 minute, or one day versus one hour, are stronger than those which form in shorter time frames.
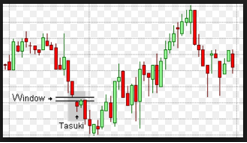
Tatsuki Gap – This is another multi-candle formation which can take up to 5 candles to form. The Tatsuki can be formed in bullish or bearish market but in either case involves two key features; a gap and a test of support/resistance. The pattern forms in a trend market when prices gap in the direction of the trend. In a down trend this would be a down gap. The candle may not be overly large but will be a long and black, closing at or near the low of the day. The next few candles will pull back to the open of the first candle at test it for resistance. Entry can be taken at this level but a confirmation of resistance makes a stronger signal, such as a second drop from this level. The confirmation candle doesn’t have to close below the first candle but the entire pattern should have noticeably higher volume. This signal has about a 65% success rate.