2 Factors To Look Out For That Support Your Trade
November 7, 2012
I’ve been backed up with outside work lately and haven’t been keeping pace with trading and updating my blog regularly so I do apologize for that.
Today, I’ll be sharing a trade that I took way back on October 25 on the EUR/USD.

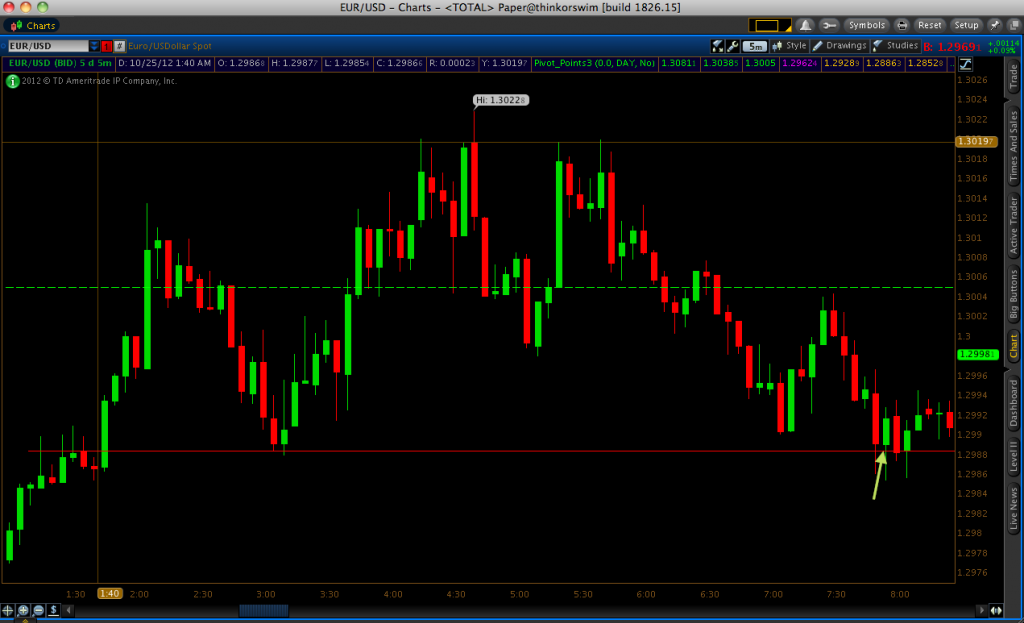
The pair was directionless that day and trend wasn’t a factor in determining whether it would be safer to stick exclusively with call or put options. As can be determined from the screenshot above, there were two major price levels that price respected throughout the European session. The main support existed notably around 1.29885, where I placed a red line for visual reference. The main resistance, where I wasn’t able to catch a trade due to being away from the computer, occurred around 1.3020.
My trade, as designated by the green arrow on the screenshot, occurred at the support level on the 7:55 candle for an 8:15AM expiration. Price was finding early resistance around 1.29885 during early European trading (1:10AM-1:40AM EST) before breaking through to form new highs for the day. However, we saw a retracement back toward the level at around 3:00AM, before bouncing twice and going back to the northside. To me, this was confirmation of a strong intraday support level and would provide the potential for a trade opportunity should price get back there in the near-term.
Also, as previously mentioned, the EUR/USD was forming a strong price resistance along the 1.3020 level. The 5:15 and 5:35 candles (both green candles with wicks bouncing off 1.3020) would have presented strong put options trades, both of which would have worked out for essentially any type of expiry (e.g., 10-minute, 15-minute, 30-minute, hourly) that day.
The trade I took occurred later on the 7:55 candle specified by the green candle for a call option. I was actually quite patient with this trade. I didn’t take the trade on the previously candle despite the 1.29885 level proving itself to be a strong support earlier. The trend had been mostly down for nearly two-and-a-half hours, plus the 7:50 candle had been showing significant downward momentum. It had been down six pips in a span of two minutes. When momentum is that substantial, it’s always best to remain careful by being patient and watching out for a potential break.
Nevertheless, although the 1.29885 price level was breached, it wicked back above on the 7:50 candle. Based on this rejection, I decided that taking a trade on the 7:55 candle would be relatively safe and have a pretty good chance of working out. It didn’t turn out to be the most perfect trade, in that it didn’t constantly stay in my favor throughout. In fact, I was down almost three pips less than ten minutes before expiration. But the price support expectedly did hold and eventually close out at about a four-pip winner.
Also note during this trading day, price had little sensitivity to the 1.3000 level, a significant whole number on the pair that often serves as a notable price distinction. Looking at the chart, one could argue that it did form some minor support and resistance, but it never reliably held for more than 5-10 minutes. Sometimes these whole numbers can be great areas to trade, but on some days they can be rather unimportant, especially when price has been testing and breaching it repeatedly.
When trading, it’s always best to look for at least two factors that support your trade. For me, a clearly defined price level is the most important, followed by how price is acting around that level. As subsidiary factors, I might consider short-term trend followed by long-term trend, if either are applicable. If you have any comments or questions just leave a message below and I’ll get back to ya.